
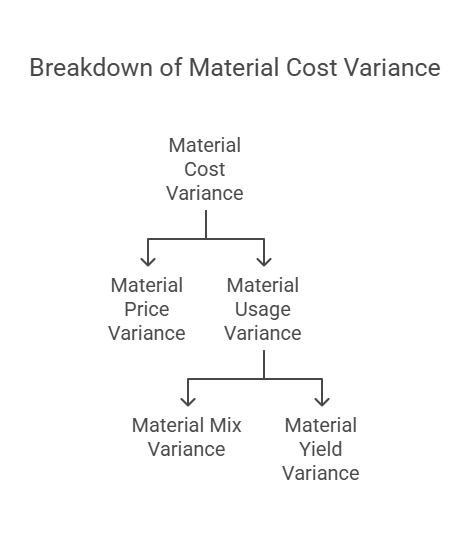
Material Cost Variance
Material Cost Variance (MCV)
The Material Cost Variance (MCV) measures the difference between the standard cost of direct materials allowed for the actual output achieved and the actual cost of direct materials used. Essentially, it tells you how much more or less you spent on materials than you expected to, based on your standards.
Formula
The MCV is calculated using the following formula:
- Material Cost Variance(MCV) = Standard cost of actual output(SC) – Actual cost(AC)
Further on expanding:
- MCV = (Standard Quantity for Actual Output * Standard Price) - (Actual Quantity * Actual Price)
Or, more concisely:
-
MCV = (SQ * SP) - (AQ * AP)
Where:
-
SQ: Standard Quantity of materials allowed for the actual output. This is how much material should have been used to produce the actual number of units, according to your standards.
-
SP: Standard Price per unit of material. This is the expected price you should have paid for the material.
-
AQ: Actual Quantity of materials used. This is how much material was actually consumed in production.
-
AP: Actual Price per unit of material. This is the price you actually paid for the material.
Example: Sunmica Tops for Tables
Let's break down the example provided:
Given Data:
- Standard quantity of sunmica per table = 4 sq. ft
- Standard price per sq. ft of sunmica = ₹5
- Actual production of tables = 1,000
- Sunmica actually used = 4,300 sq. ft
- Actual purchase price of sunmica per sq. ft = ₹5.50
Calculation:
-
Standard Quantity for Actual Output (SQ): 1,000 tables * 4 sq. ft/table = 4,000 sq. ft
-
Standard Cost (SC): 4,000 sq. ft * ₹5/sq. ft = ₹20,000
-
Actual Cost (AC): 4,300 sq. ft * ₹5.50/sq. ft = ₹23,650
-
Material Cost Variance (MCV): ₹20,000 - ₹23,650 = -₹3,650
Result and Interpretation:
The MCV is -₹3,650. This is an unfavorable variance. It means that the company spent ₹3,650 more on sunmica than the standard cost allowed for the actual production of 1,000 tables.
Further Analysis
While the MCV tells us that there's a variance, it doesn't tell us why. Further investigation is needed. We can break down the MCV into two components:
- Material Price Variance: This looks at the difference between the standard price and the actual price.
- Material Usage Variance: This looks at the difference between the standard quantity allowed and the actual quantity used.
Material Price Variance (MPV)
The Material Price Variance (MPV) isolates the portion of the total material cost variance that is specifically caused by the difference between the STANDARD PRICE OF THE MATERIAL and the ACTUAL PRICE paid for it. It focuses solely on the price aspect of material costs, independent of the quantity used.
Formula
The MPV is calculated using the following formula:
- MPV = (Standard Price - Actual Price) * Actual Quantity
Or, more concisely:
- MPV = (SP - AP) * AQ
Where:
- SP: Standard Price per unit of material. This is the expected price you should have paid for the material.
- AP: Actual Price per unit of material. This is the price you actually paid for the material.
- AQ: Actual Quantity of materials purchased (or sometimes, depending on the context, the actual quantity used). It's important to be consistent in your application of AQ. If you're looking at purchase price variances, use the quantity purchased. If you're looking at price variances related to materials used, then use the quantity used.
Interpretation
- Positive MPV (Favorable): A positive MPV indicates that the actual price paid for the material was lower than the standard price. This is a favorable variance.
- Negative MPV (Unfavorable): A negative MPV indicates that the actual price paid for the material was higher than the standard price. This is an unfavorable variance.
Example: Sunmica Tops for Tables (Continued)
Using the same data as before:
Given Data:
- Standard quantity of sunmica per table=4 sq. ft
- Standard price per sq. ft of sunmica (SP) = ₹5
- Actual production of tables=1,000
- Actual purchase price per sq. ft of sunmica (AP) = ₹5.50
- Sunmica actually used (AQ) = 4,300 sq. ft
Calculation:
MPV = (₹5 - ₹5.50) * 4,300 MPV = (-₹0.50) * 4,300 MPV = -₹2,150
Result and Interpretation:
The MPV is -₹2,150. This is an unfavorable variance. It shows that the company paid ₹2,150 more for the sunmica than the standard price allowed, solely due to the higher purchase price.
Reasons for Material Price Variance
Several factors can contribute to a material price variance:
-
Changes in Market Prices: Fluctuations in market conditions, supply and demand, and commodity prices can affect the cost of raw materials.
-
Changes in Purchase Quantities and Discounts: Buying in larger quantities might lead to higher discounts, while smaller purchases might result in losing out on potential discounts.
-
Inefficient Purchasing: Poor negotiation skills, inadequate supplier research, or failure to take advantage of favorable market conditions can lead to higher prices.
-
Changes in Delivery Costs: Increases in transportation costs, fuel surcharges, or changes in shipping methods can impact the overall cost of materials.
-
Rush/Emergency Purchases: Urgent orders often require paying premium prices to secure materials quickly.
Material Usage (or Quantity) Variance (MUV)
The Material Usage Variance (MUV), also known as the Material Quantity Variance, measures the portion of the total material cost variance that is caused by the difference between the STANDARD QUANTITY of materials allowed for the actual output and the ACTUAL QUANTITY of materials used. It isolates the impact of using more or less material than expected, independent of price fluctuations.
Formula
The MUV is calculated using the following formula:
- MUV = (Standard Quantity for Actual Output - Actual Quantity) * Standard Price
Or, more concisely:
- MUV = (SQ - AQ) * SP
Where:
- SQ: Standard Quantity of materials allowed for the actual output. This is how much material should have been used to produce the actual number of units, according to your standards.
- AQ: Actual Quantity of materials used in production. This is how much material was actually consumed.
- SP: Standard Price per unit of material. This is the expected price you should have paid for the material. It's important to note that we use the standard price here, as we're isolating the impact of quantity differences, not price differences.
Interpretation
- Positive MUV (Favorable): A positive MUV indicates that less material was used than the standard allowed for the actual output. This is a favorable variance.
- Negative MUV (Unfavorable): A negative MUV indicates that more material was used than the standard allowed for the actual output. This is an unfavorable variance.
Example: Sunmica Tops for Tables (Continued)
Using the same data as before:
Given Data:
- Standard quantity of sunmica per table (SQ per table) = 4 sq. ft
- Standard price per sq. ft of sunmica (SP) = ₹5
- Actual production of tables = 1,000
- Sunmica actually used (AQ) = 4,300 sq. ft
Calculation:
-
Standard Quantity for Actual Output (SQ): 1,000 tables * 4 sq. ft/table = 4,000 sq. ft
-
Material Usage Variance (MUV): (4,000 sq. ft - 4,300 sq. ft) * ₹5/sq. ft MUV = (-300 sq. ft) * ₹5/sq. ft MUV = -₹1,500
Result and Interpretation:
The MUV is -₹1,500. This is an unfavorable variance. It means that 300 more sq. ft of sunmica were used than the standard allowed for the production of 1,000 tables. This resulted in an additional cost of ₹1,500.
Reasons for Material Usage Variance
Several factors can contribute to a material usage variance:
-
Use of Defective or Substandard Materials: If the raw materials are of poor quality, more material might be needed to achieve the desired output.
-
Carelessness in Material Usage: Wasteful practices, improper handling, or lack of training can lead to excessive material consumption.
-
Pilferage: Theft or unauthorized removal of materials can result in shortages and necessitate using more material than planned.
-
Poor Workmanship: Inefficient or poorly trained workers might make mistakes that lead to material waste.
-
Defects in Plant and Machinery: Malfunctioning equipment can cause material spoilage or require more material to be used due to inefficiencies.

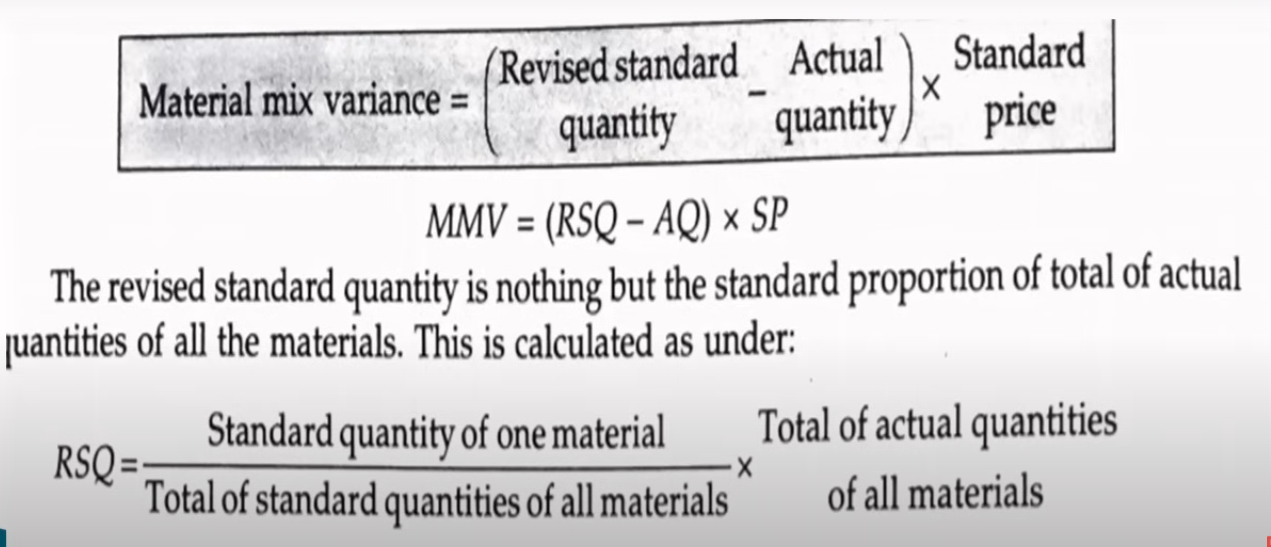
Material Mix Variance
The Material Mix Variance is a specific component of the Material Usage Variance. It measures the financial impact of using a different proportion of materials in a mix than what was specified in the standard. This variance is particularly relevant in industries where products are made by combining multiple raw materials in specific ratios, such as in chemical, pharmaceutical, food processing, and rubber manufacturing.
What is the Material Mix Variance?
In these industries, the standard cost of a product is often based on a predefined "standard mix" of ingredients or components. The Material Mix Variance arises when the actual mix of materials used in production deviates from this standard mix. This deviation can occur for various reasons, such as:
-
Non-availability of certain materials: If a particular material is unavailable, substitutions might be necessary, altering the mix.
-
Changes in material prices: If one material becomes significantly more expensive, there might be an incentive to use a higher proportion of a cheaper substitute (if possible), again changing the mix.
-
Production constraints: Equipment limitations or process adjustments might necessitate using a different mix than the standard.
-
Errors in mixing: Human error or automated system malfunctions can lead to deviations from the standard mix.

Interpretation
-
Positive MMV (Favorable): A positive MMV indicates that the actual mix used was less expensive than the standard mix for the same total quantity of output. This usually means a higher proportion of less expensive materials was used.
-
Negative MMV (Unfavorable): A negative MMV indicates that the actual mix used was more expensive than the standard mix for the same total quantity of output. This usually means a higher proportion of more expensive materials was used.
Material Yield Variance (MYV)
The Material Yield Variance (MYV) is a component of the Material Usage Variance. It specifically measures the impact of the difference between the standard yield (expected output) and the actual yield (actual output) obtained from a given quantity of input materials. It focuses on the efficiency of the production process in converting raw materials into finished goods.
What is Yield?
- Standard Yield: The expected output (in units or kg, etc.) from a given quantity of input materials, as defined by the standard.
- Actual Yield: The actual output obtained from the actual quantity of input materials used.
Formula
The Material Yield Variance is calculated as:
- Material Yield Variance = (Actual Yield - Standard Yield) * Standard Output Price
Or, more concisely:
- MYV = (AY - SY) * SOP
Where:
- AY: Actual Yield (actual output obtained).
- SY: Standard Yield (expected output for the actual quantity of input materials used).
- SOP: Standard Output Price (the standard cost or price per unit of output).
Interpretation
- Positive MYV (Favorable): A positive MYV indicates that the actual yield was higher than the standard yield for the actual input quantity. This means more output was produced than expected from the same amount of material, which is favorable.
- Negative MYV (Unfavorable): A negative MYV indicates that the actual yield was lower than the standard yield for the actual input quantity. This means less output was produced than expected from the same amount of material, which is unfavorable.