
Forecasting with GARCH Models
Introduction to Forecasting with GARCH Models
One of the primary uses of GARCH models is forecasting future volatility, which is crucial for risk management, option pricing, and portfolio optimization. The forecasting process involves predicting future values of the conditional variance (σ_t^2) based on the model’s parameters and available information.
Forecasting Procedure
The forecasting process for GARCH models follows a systematic approach that uses the model's estimated coefficients to predict future conditional variances. These forecasts are generated recursively, with each forecast depending on the previous one.
One-Step-Ahead Forecast
The one-step-ahead forecast of the conditional variance (σ_{t+1}^2) is calculated using the following formula:
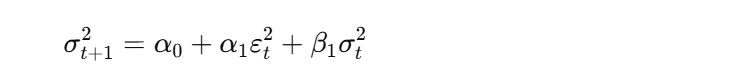
Where:
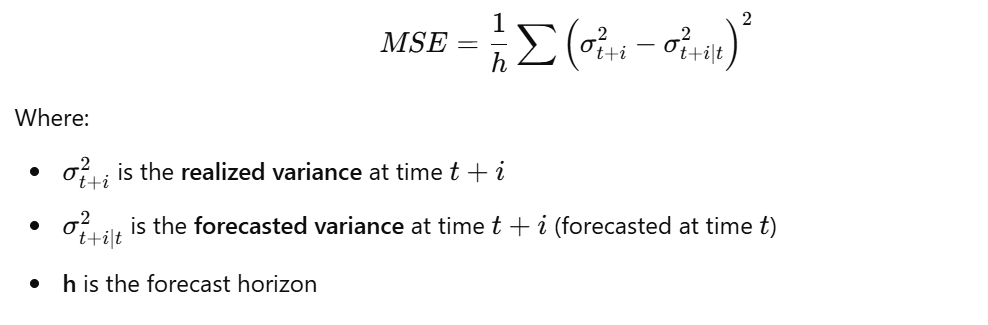
- σ_{t+1}^2 is the one-step-ahead forecast of the conditional variance at time ( t+1 )
- α_0, α_1, β_1 are the ARCH and GARCH coefficients
- ε_t is the most recent error term
- σ_t^2 is the most recent conditional variance
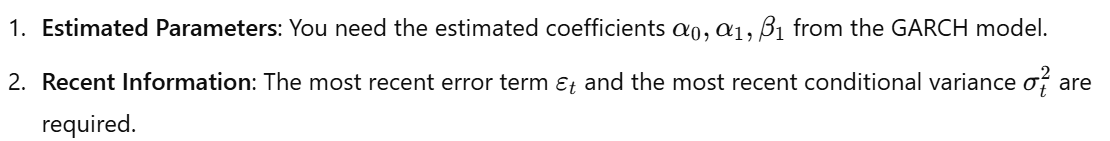
Key Steps for One-Step Forecast:
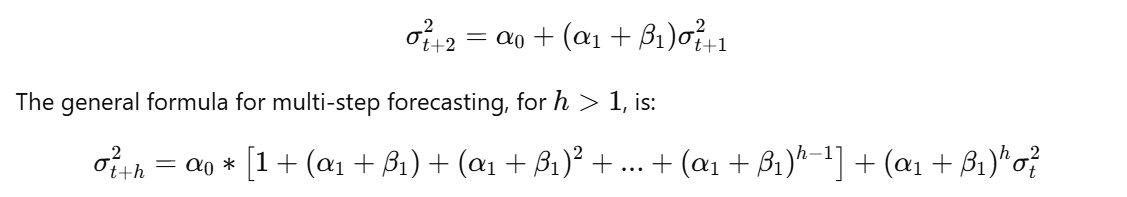
Multi-Step-Ahead Forecasts
For multi-step-ahead forecasts, you need to compute forecasts for each successive step, where each forecast depends on the previous one. For example, the forecast for the second step (σ_{t+2}^2) is calculated as:
Unconditional Variance:
- As the forecast horizon increases, the forecast converges to the unconditional variance:


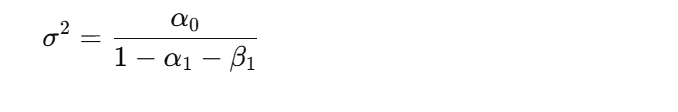
Unconditional Variance
The unconditional variance represents the long-term average level of volatility. It is calculated as:

Incorporating the Mean Equation
- Impact of Mean Forecast: Sometimes, forecasts from the mean equation, such as an ARMA model for mean returns, may be incorporated into volatility forecasting. However, for short-term forecasts, the impact of the mean forecast is usually minimal.
Evaluating Forecast Accuracy
The accuracy of volatility forecasts can be evaluated using various statistical measures:
Mean Squared Error (MSE):
Root Mean Squared Error (RMSE):
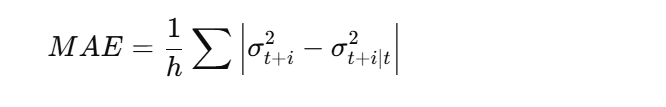
Mean Absolute Error (MAE):
Mincer-Zarnowitz Regression:
- This involves regressing the realized variance on the forecasted variance and checking if the coefficients are 0 and 1, respectively.
Rolling Window Approach
In practice, GARCH models are often estimated using the rolling window approach, where a fixed-size window of data is used to estimate the model parameters. The window "rolls forward" in time, updating the parameter estimates and generating new forecasts.
Software Implementation
Many statistical software packages, including R, Python, and EViews, provide robust tools for estimating and forecasting with GARCH models.
-
R: The
rugarchpackage in R allows users to specify, fit, and forecast GARCH models. -
Python: The
archpackage in Python provides similar functionality. - EViews: This commercial statistical package also supports GARCH modeling.
Conclusion
GARCH models provide a powerful tool for forecasting volatility, which is essential for various financial applications such as portfolio optimization, risk management, and option pricing. These models produce volatility forecasts recursively, with the accuracy of these forecasts evaluated using statistical measures. The rolling window approach is often used in practice to ensure the model adapts to changes in volatility dynamics.