
Income Statement and Balance Sheet Analysis
Ratio & DuPont Analysis
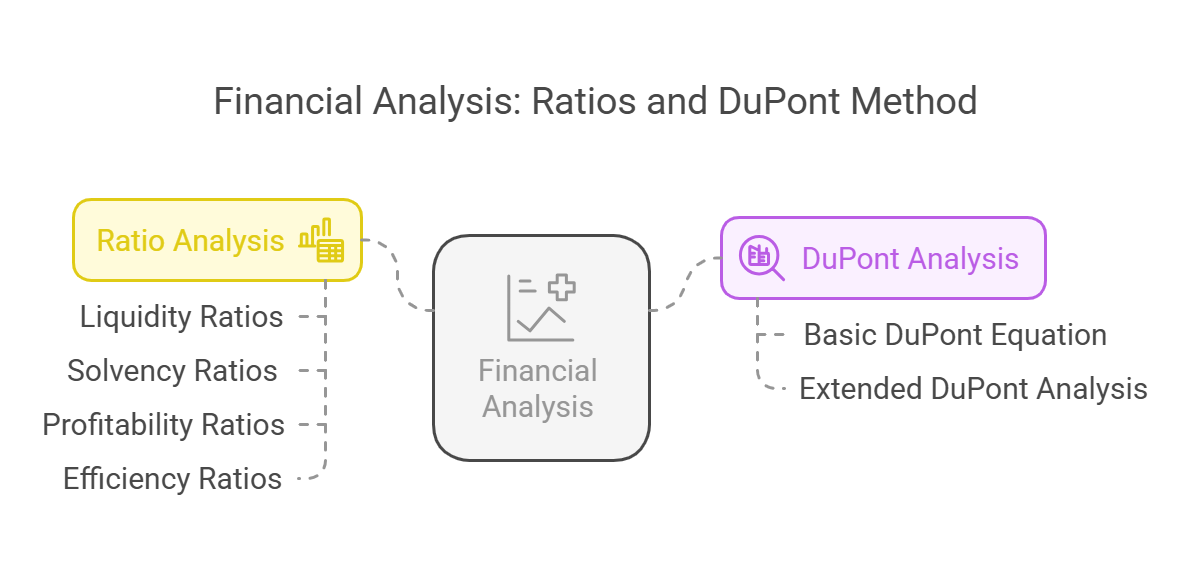
Analyzing financial statements like the income statement and balance sheet is crucial for understanding a company's performance and financial health. Ratios provide insights into various aspects, while DuPont analysis breaks down Return on Equity (ROE) for a deeper dive.
1. Ratio Analysis:
Ratios standardize financial data, allowing for comparisons across different companies and time periods. They are broadly categorized as:
-
Liquidity Ratios: Assess a company's ability to meet short-term obligations.
- Current Ratio: Current Assets / Current Liabilities (Ideally > 1) - Indicates ability to pay short-term debts.
- Quick Ratio (Acid-Test Ratio): (Current Assets - Inventory) / Current Liabilities - More stringent, excludes less liquid inventory.
-
Solvency (Leverage) Ratios: Evaluate a company's ability to meet long-term obligations and its debt levels.
- Debt-to-Equity Ratio: Total Debt / Total Equity - Shows the proportion of debt financing relative to equity.
- Debt-to-Assets Ratio: Total Debt / Total Assets - Indicates the proportion of assets financed by debt.
- Times Interest Earned: EBIT / Interest Expense - Measures the company's ability to cover its interest payments.
-
Profitability Ratios: Measure a company's ability to generate profits relative to revenue, assets, or equity.
- Gross Profit Margin: Gross Profit / Revenue - Shows the percentage of revenue remaining after deducting the cost of goods sold.
- Operating Profit Margin: Operating Income (EBIT) / Revenue - Indicates the profitability of core operations.
- Net Profit Margin: Net Income / Revenue - Represents the percentage of revenue that translates into profit after all expenses.
- Return on Assets (ROA): Net Income / Total Assets - Measures how efficiently a company uses its assets to generate profit.
- Return on Equity (ROE): Net Income / Total Equity - Measures the return generated for shareholders' investment.
-
Efficiency (Activity) Ratios: Assess how efficiently a company uses its assets to generate revenue.
- Inventory Turnover: Cost of Goods Sold / Average Inventory - Indicates how quickly inventory is sold.
- Accounts Receivable Turnover: Revenue / Average Accounts Receivable - Measures how quickly a company collects its receivables.
- Asset Turnover: Revenue / Total Assets - Shows how efficiently a company uses its assets to generate sales.
2. DuPont Analysis:
DuPont analysis breaks down ROE into its component parts, providing a more detailed understanding of the factors driving profitability. The basic 3-step DuPont equation is:
ROE = Net Profit Margin * Asset Turnover * Equity Multiplier
- Net Profit Margin: As defined above, profitability per dollar of sales.
- Asset Turnover: As defined above, efficiency in using assets to generate sales.
- Equity Multiplier: Total Assets / Total Equity - Measures financial leverage; a higher multiplier indicates more debt financing.
Extended DuPont Analysis (5-step):
Expands the analysis to provide even more granular insights:
ROE = (Net Income / EBT) * (EBT / EBIT) * (EBIT / Revenue) * (Revenue / Total Assets) * (Total Assets / Total Equity)
- (Net Income / EBT): Tax Burden - Measures the impact of taxes on profitability.
- (EBT / EBIT): Interest Burden - Measures the impact of interest expense on profitability.
- (EBIT / Revenue): Operating Margin - As defined above.
- (Revenue / Total Assets): Asset Turnover - As defined above.
-
(Total Assets / Total Equity): Equity Multiplier - As defined above.
 Interpretation:
By analyzing these ratios and the DuPont breakdown, you can identify strengths and weaknesses in a company's financial performance. For example, a declining ROE might be due to a decrease in profit margin, inefficient asset utilization, or excessive leverage. Comparing these ratios to industry averages and historical trends provides a more comprehensive picture. Remember that context is crucial. Consider industry-specific characteristics and economic conditions when interpreting the results.
No Comments