
Risk-Adjusted Return Measures
Evaluating Performance Beyond Simple Returns
Raw return figures only tell part of the story. To make meaningful comparisons between investments, you must consider the risk taken to achieve those returns. Risk-adjusted return measures provide a more comprehensive assessment of investment performance.
1. Sharpe Ratio:
-
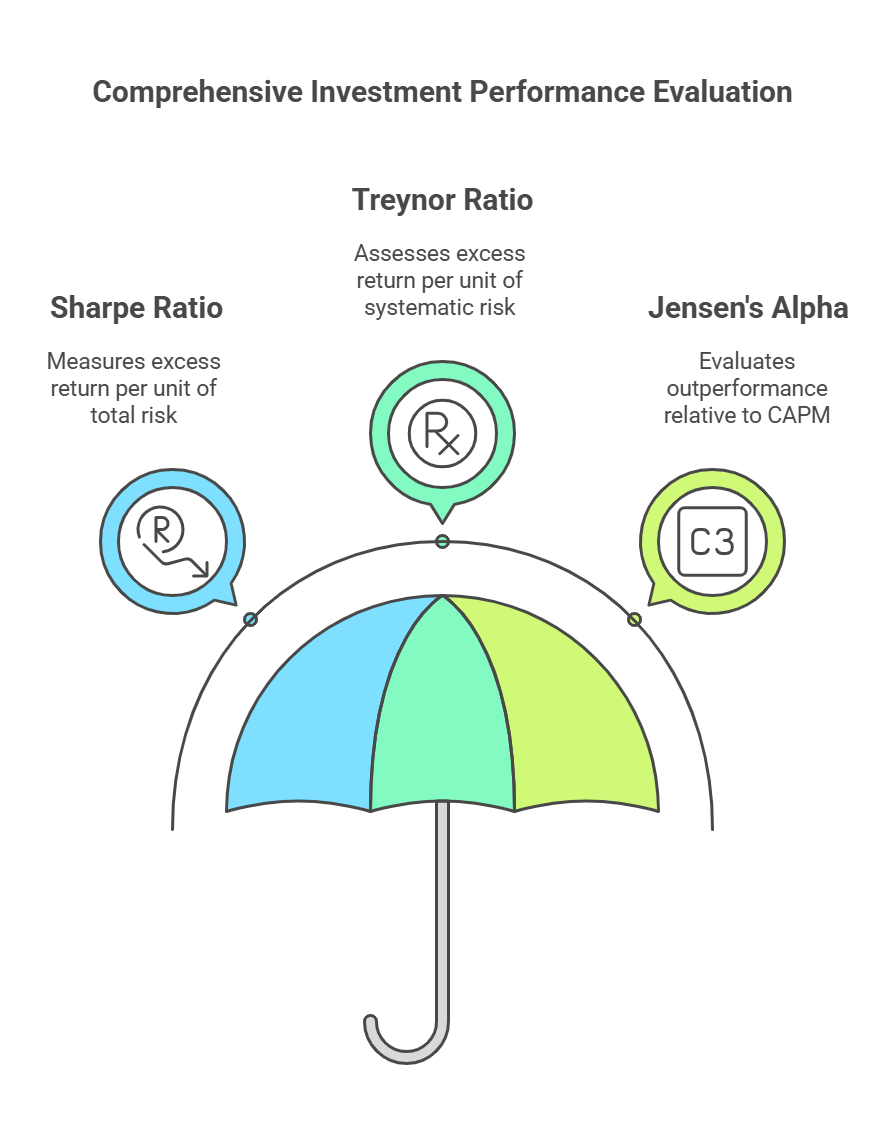
Definition: Measures the excess return per unit of total risk. It quantifies how much additional return an investor receives for taking on each unit of risk (as measured by standard deviation).
-
Formula (as provided):
Sharpe Ratio = (Rp - Rf) / σp -
Components Explained:
-
Rp: Portfolio Return -
Rf: Risk-Free Rate of Return (e.g., return on a government bond) -
σp: Standard Deviation of the portfolio (a measure of total risk)
-
-
Interpretation: A higher Sharpe Ratio indicates better risk-adjusted performance. It suggests that the investment generated more return for the level of risk taken.
-
Utility (as provided): Helps compare investments with different risk levels, allowing investors to identify investments that offer the best risk-reward profile.
-
Limitations:
- Assumes Normality: Assumes returns are normally distributed, which may not always be the case.
- Sensitive to Outliers: Can be influenced by extreme returns.
- May not be appropriate for all asset classes.
2. Treynor Ratio:
-
Definition: Measures the excess return per unit of systematic risk (beta). It quantifies how much additional return an investor receives for taking on each unit of systematic risk, which is the risk that cannot be diversified away.
-
Formula (as provided):
Treynor Ratio = (Rp - Rf) / βp -
Components Explained:
-
Rp: Portfolio Return -
Rf: Risk-Free Rate of Return -
βp: Beta of the portfolio (a measure of systematic risk)
-
-
Interpretation: A higher Treynor Ratio indicates better risk-adjusted performance, specifically in relation to systematic risk.
-
Utility (as provided): Helps compare investments with different risk levels, focusing specifically on systematic risk.
-
Limitations:
- Focuses only on systematic risk: Ignores unsystematic risk (diversifiable risk).
- Not suitable for poorly diversified portfolios: Only meaningful for well-diversified portfolios, where unsystematic risk has been largely eliminated.
3. Jensen's Alpha:
-
Definition: Measures the outperformance of an investment relative to its expected return based on the Capital Asset Pricing Model (CAPM). It assesses whether an investment has generated returns above or below what is predicted by its systematic risk (beta).
-
Formula:
Jensen's Alpha = Rp - [Rf + βp (Rm - Rf)] -
Components Explained:
-
Rp: Portfolio Return -
Rf: Risk-Free Rate of Return -
βp: Beta of the portfolio -
Rm: Market Return (Return of the benchmark index)
-
-
Interpretation: A positive Jensen's Alpha indicates that the investment has outperformed its expected return, suggesting superior management or stock selection skills. A negative Alpha indicates underperformance.
-
Utility (as provided): Helps compare investments by assessing their performance relative to what is predicted by their systematic risk.
-
Limitations:
- Relies on CAPM Assumptions: Depends on the validity of CAPM assumptions, which may not always hold true.
- Benchmark Sensitivity: Sensitive to the choice of benchmark index.
Key Points and Comparison:
- Sharpe Ratio: Uses standard deviation (total risk)
- Treynor Ratio: Uses beta (systematic risk)
- Jensen's Alpha: Measures outperformance relative to CAPM, considering systematic risk.
- The risk-free rate is often a 3-month treasury-bill and is expressed as an annualized number.
In summary, risk-adjusted return measures provide a more comprehensive assessment of investment performance than simply looking at raw returns. By considering the level of risk taken to achieve those returns, these measures allow for more meaningful comparisons between different investments and help investors make more informed decisions. It’s important to look at more than one measurement in a proper overview.
No Comments