
Technical Analysis
Charting the Course of Price Movements
Technical analysis offers a contrasting approach to fundamental analysis, focusing on historical price and volume data to attempt to predict future price movements.
Basic Tenets of Technical Analysis :
- Market Discounts Everything: All known information is reflected in the price.
- Prices Move in Trends: Prices move in sustained directions (up, down, sideways).
- History Tends to Repeat: Patterns and behaviors recur.
Tools of Technical Analysis:
-
Charts: Visual representations of price data.
-
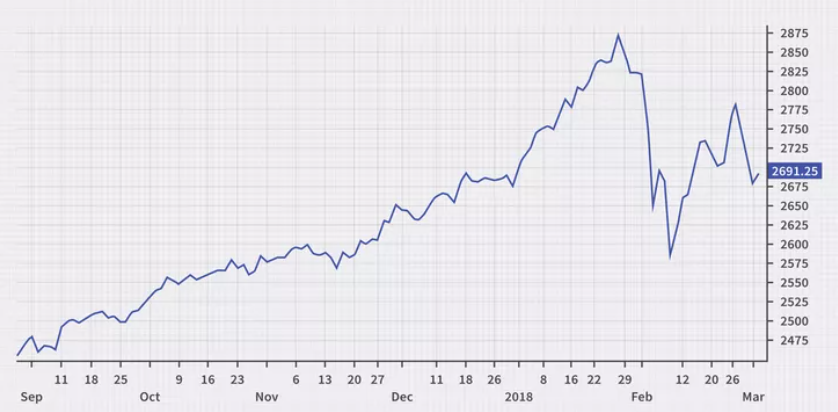
Line Chart : Connects closing prices. Simplicity is its asset.
-
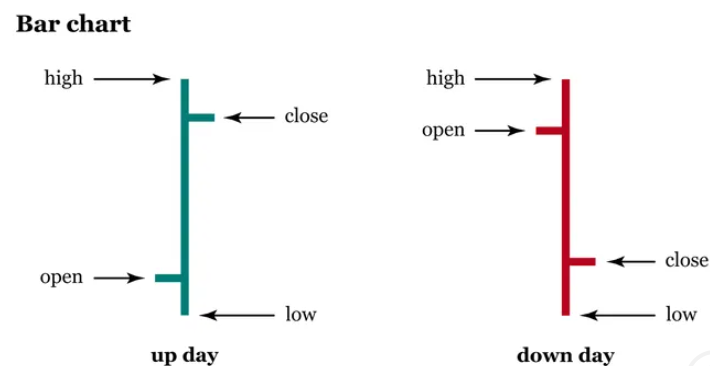
Bar Chart : Shows OHLC (Open, High, Low, Close). Example: See previous iterations.

-
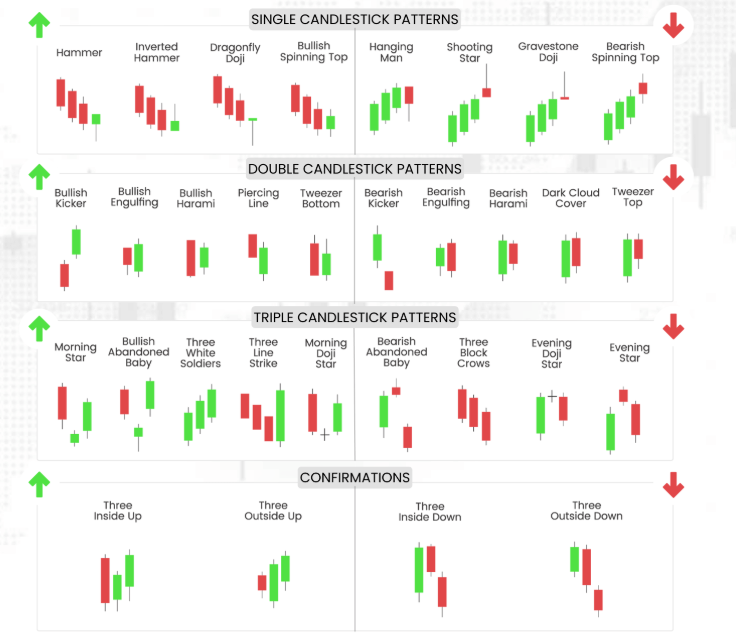
Candlestick Chart : Shows OHLC with "body" and "wicks" (tails). Key patterns include:
- Doji: Small body, long wicks. Signals potential reversal.
- Hammer: Small body at the top, long lower wick. Bullish reversal signal.

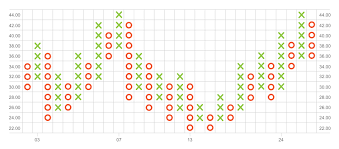
- Point and Figure Chart: A more customized chart without a time aspect.
-
Line Chart : Connects closing prices. Simplicity is its asset.

-
Technical Indicators:
-
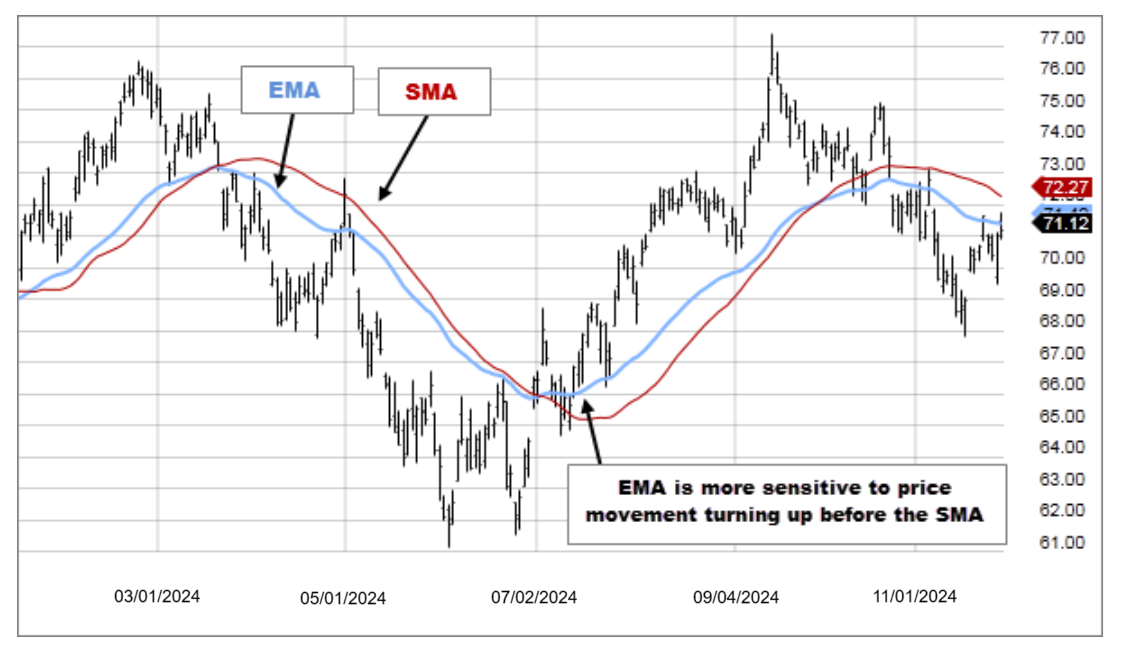
Moving Averages (SMA & EMA):
- Example: A 50-day SMA is often used to gauge the intermediate-term trend of a stock. A stock consistently above its 50-day SMA might be considered in an uptrend.
-
Moving Averages (SMA & EMA):
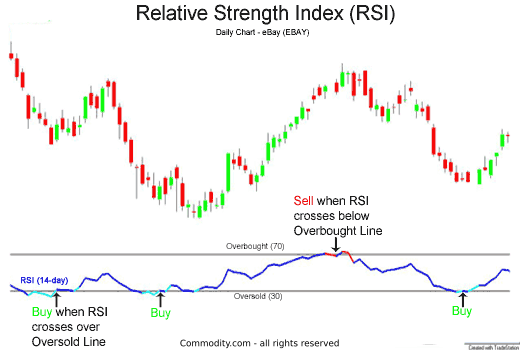
 * Relative Strength Index (RSI):
* Example: If the RSI is above 70, the stock is “overbought,” which could indicate an oncoming correction. If it’s below 30, then the stock is likely oversold.
* Relative Strength Index (RSI):
* Example: If the RSI is above 70, the stock is “overbought,” which could indicate an oncoming correction. If it’s below 30, then the stock is likely oversold.
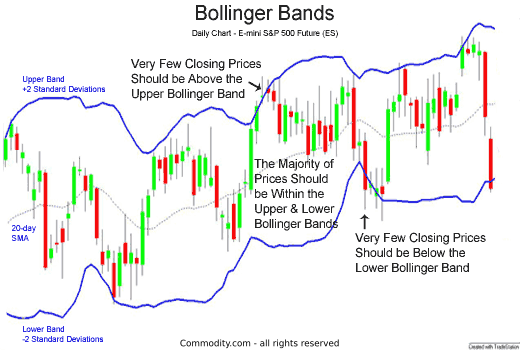
 * Bollinger Bands:
* Example: A strong surge towards the upper Bollinger band is a bullish signal and vice versa.
* Bollinger Bands:
* Example: A strong surge towards the upper Bollinger band is a bullish signal and vice versa.
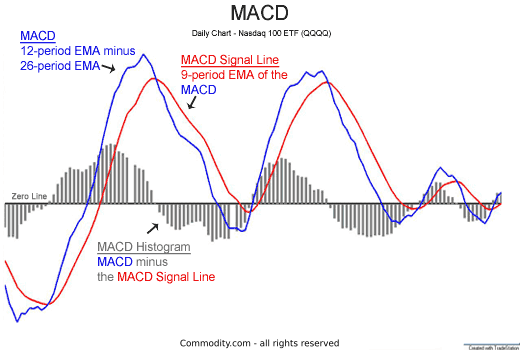
 * MACD:
* Example: When the MACD line crosses above the signal line, it is a bullish signal (buy). When it crosses below the signal line, it is a bearish signal (sell).
* MACD:
* Example: When the MACD line crosses above the signal line, it is a bullish signal (buy). When it crosses below the signal line, it is a bearish signal (sell).
-
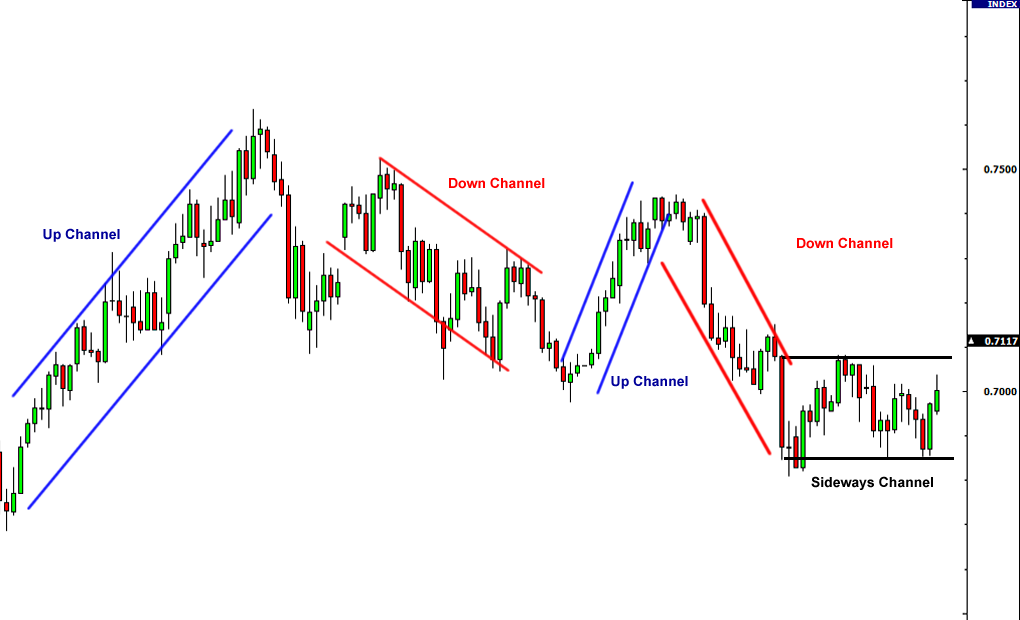
Trendlines and Channels: One of the foundations of TA
- The direction of the line must always be correct to be effective and tell the correct information.
-
Example: A price chart is clearly trending upwards if its price, with oscillations, is consistently moving higher. Conversely, if the peaks are consistently moving lower, then it’s trending downwards.
-
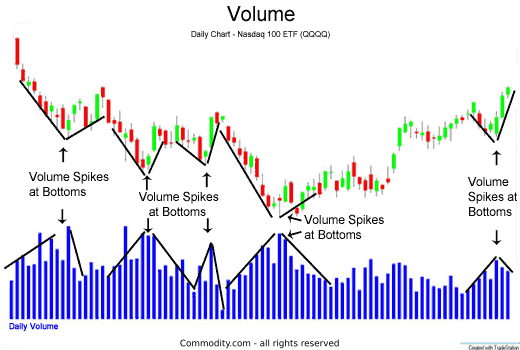
Volume Analysis
-
Volume precedes price
- To properly assess the current position of the market, volume must be looked at before price.

-
-
Fibonacci Retracements:
- Uses Fibonacci ratios (23.6%, 38.2%, 50%, 61.8%, 78.6%) as potential support or resistance levels.
- Example: If a stock retraces to the 61.8% Fibonacci level after an upward move, it may find support there and resume its uptrend.
- Note: The golden ratio is 61.8%, is one of the most accurate measurements in TA.

6. Chart Patterns:
-
These are geometric shapes formed on price charts that suggest future price movements.
-
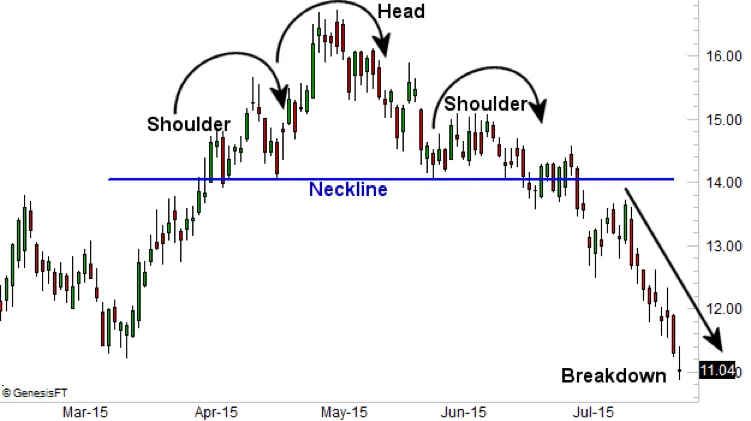
Head and Shoulders:
-
Example: The stock price is a shoulder, then goes high to form a new shoulder, and a new high. It’s a signal that the upwards trend is done. Look to see if it goes down after this.
-
Example: The stock price is a shoulder, then goes high to form a new shoulder, and a new high. It’s a signal that the upwards trend is done. Look to see if it goes down after this.
-
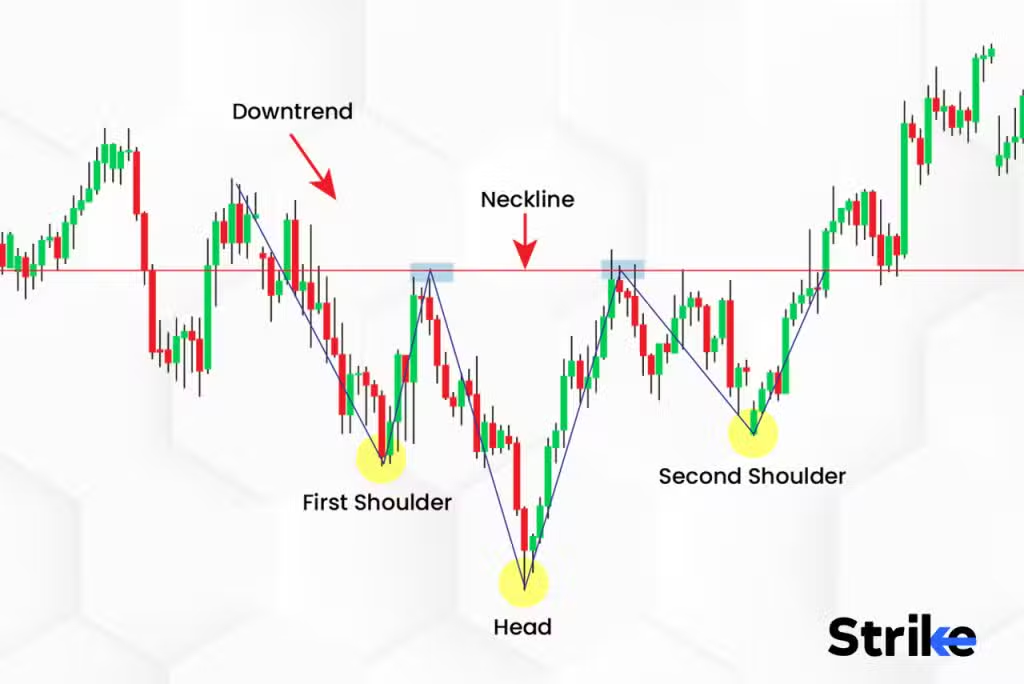
Inverse Head and Shoulders :
-
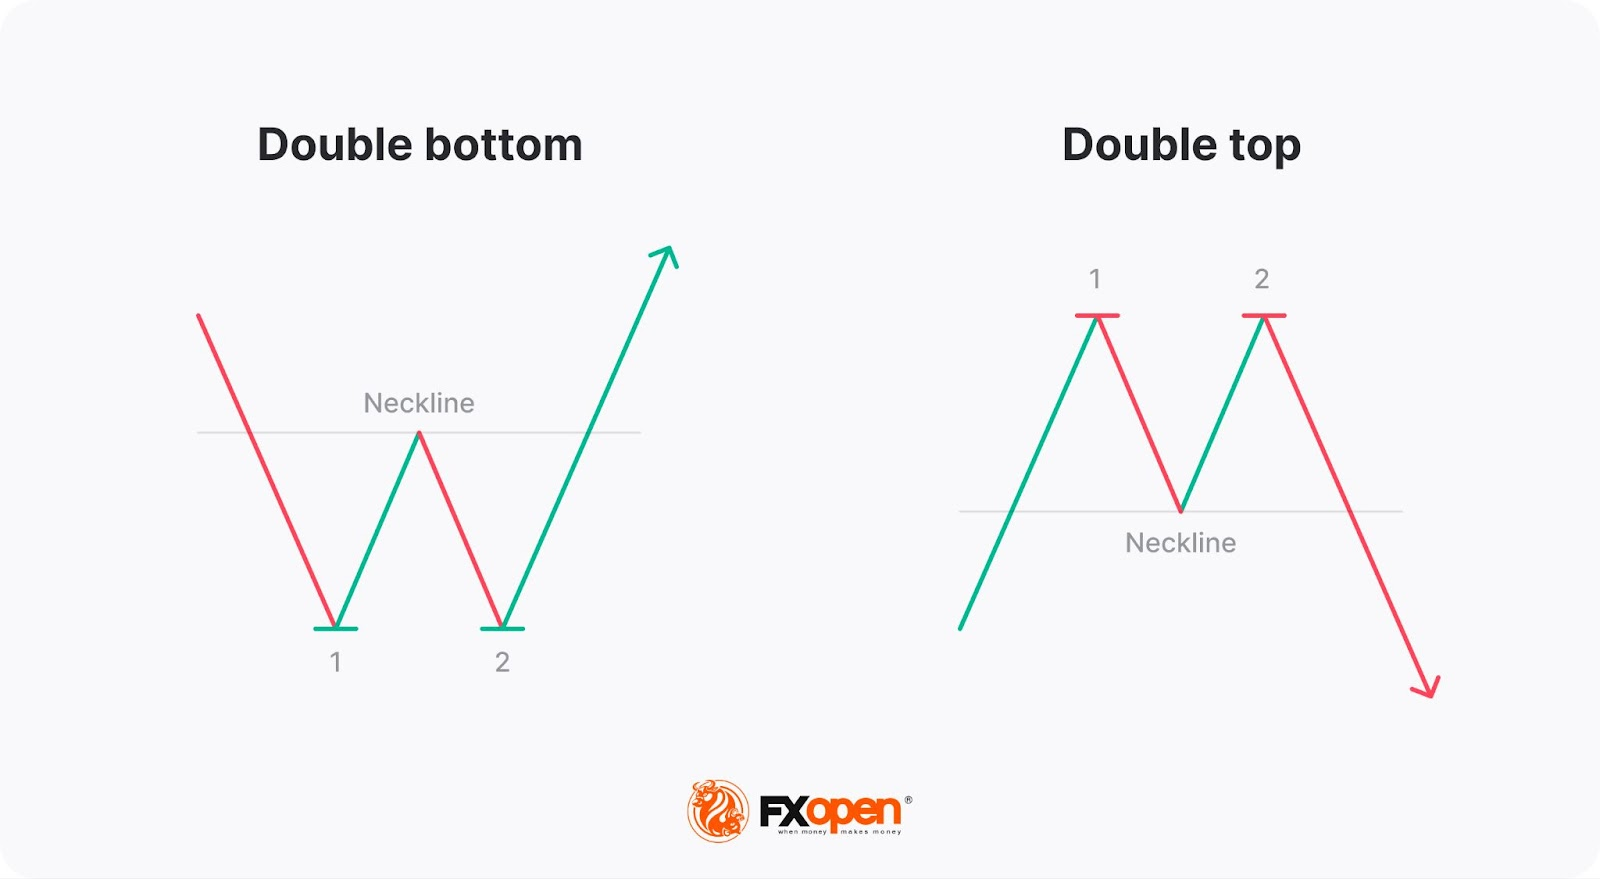
Double Top and Double Bottom :
-
A clear signal that the price action has been tested and a new direction is upcoming.
-
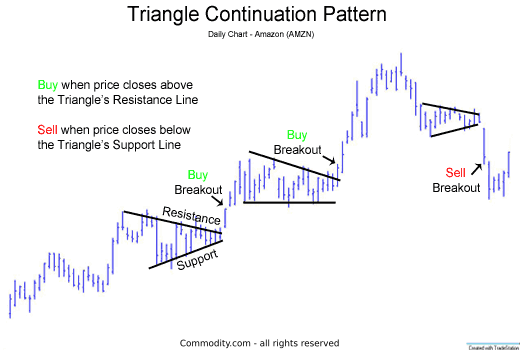
Triangles:
-
Is generally a continuation pattern, with one side remaining flat.
-
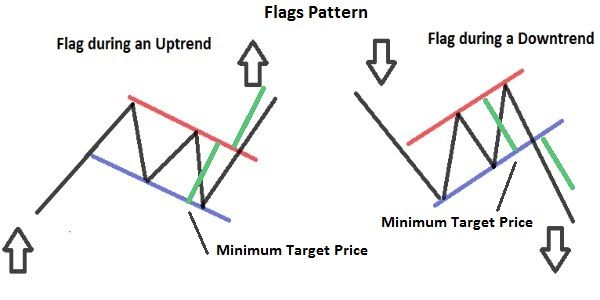
Flags and Pennants
- Indicate the prior trend is likely to resume once the pattern completes.
- Indicate the prior trend is likely to resume once the pattern completes.
-
-
The Dow Theory: The Dow Theory helps analysts to define and predict broad market trends, but is not a precise tool for short-term predictions.


Limitations of Technical Analysis :
-
Subjectivity: Interpretation varies.
-
Lagging Indicators: Indicators confirm after the fact.
-
Short-Term Focus: Best for short-term trading.
-
Self-Fulfilling Prophecy: Patterns can become self-fulfilling. If enough think that patterns will work, their very volume can cause such to happen.
-
Efficient Market Hypothesis (EMH) Challenge: EMH suggests technical analysis is ineffective.
-
Novel Events cannot be foreseen - TA is based on past data.
-
New Data Nullification: new data can nullify prior data and thus create false results. TA is, therefore, most effective if all prior data is accurate and complete.
Key Points:
- Use in conjunction with other forms of analysis.
- Combine multiple indicators and patterns.
- Acknowledge the limitations.
In summary, technical analysis provides a framework for identifying potential trading opportunities by studying historical price and volume data. However, it's important to use it with caution and to understand its limitations. A blended approach is generally considered more effective. Furthermore, one needs to be on guard that there is never a certainty of returns using TA.
No Comments