
Break Even Analysis
Break-Even Analysis
Break-even analysis is a widely used technique in cost-volume-profit (CVP) analysis to study the relationship between costs, sales volume, and profitability.
Interpretations of Break-Even Analysis
-
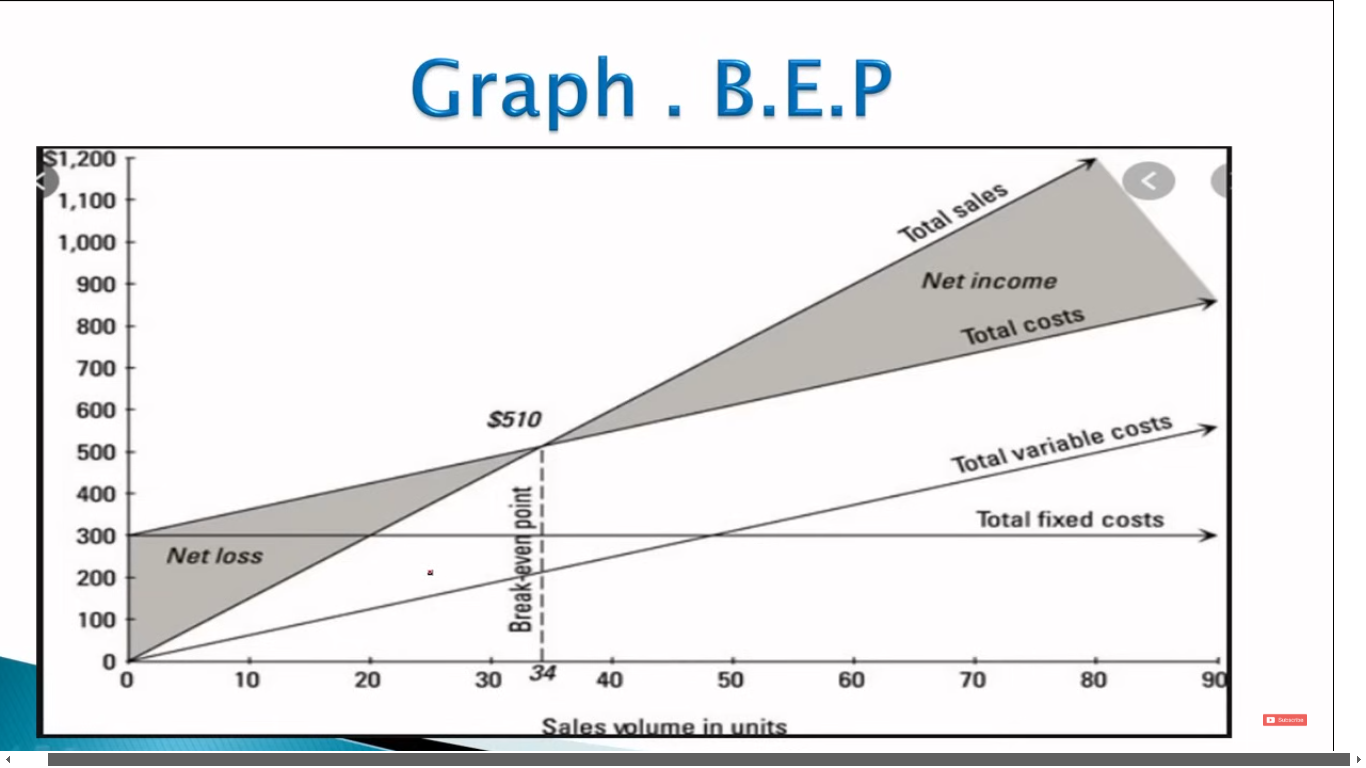
Narrow Interpretation: The break-even point is the level of activity (output or sales) where total costs equal total selling price. At this point, the business neither makes a profit nor incurs a loss.
-
Broader Interpretation: Break-even analysis is a system of analysis that determines the probable profit (or loss) at any level of activity. It goes beyond simply finding the break-even point and examines the profit-volume relationship across different sales levels.
Break-Even Point (BEP)
The break-even point is the level of output or sales where total costs (fixed and variable) equal total revenue. It's the point where the business's income exactly equals its expenditures.
-
Key Characteristics at BEP:
- Total Cost = Total Sales
- Income = Expenditure
- Profit = Zero
-
Relationship to Production Levels:
- Production > BEP: Profit will accrue.
- Production < BEP: Loss will be incurred.
Break-Even Point Formulas
-
Break-Even Point (in Units):
BEP (Units) = Fixed Costs / Contribution per Unit
-
Break-Even Point (in Sales Revenue):
BEP (Sales) = (Fixed Costs / Contribution per Unit) * Selling Price per Unit
OR
BEP (Sales) = (Fixed Costs / Total Contribution) * Total Sales
OR
BEP (Sales) = Fixed Costs / P/V Ratio
Where P/V Ratio = (Selling Price per Unit - Variable Cost per Unit) / Selling Price per Unit (also known as the Contribution Margin Ratio)

Desired Profit and Break-Even Analysis
At the break-even point, the desired profit is zero. However, break-even analysis can be extended to determine the sales volume required to achieve a desired profit. To do this, the desired profit is added to the fixed costs in the formulas:
-
Units for a Desired Profit:
Units = (Fixed Costs + Desired Profit) / Contribution per Unit
-
Sales for a Desired Profit:
Sales = (Fixed Costs + Desired Profit) / P/V Ratio
Composite Break-Even and Cash Break-Even
These are variations of the traditional break-even analysis, offering more nuanced perspectives on a business's financial position.
1. Composite Break-Even
The traditional break-even analysis is most straightforward when dealing with a single product or service. However, most businesses sell a mix of products, each with its own selling price, variable cost, and contribution margin. The composite break-even point addresses this complexity. It calculates the overall break-even point for a multi-product business, taking into account the sales mix of the different products.
-
Calculation:
-
Determine the Sales Mix: Calculate the proportion of each product's sales relative to total sales.
-
Calculate the Weighted Average Contribution Margin: Multiply each product's contribution margin by its sales mix percentage, and then sum these results.
-
Calculate the Composite Break-Even Point (in Units):
Composite BEP (Units) = Fixed Costs / Weighted Average Contribution Margin
-
Calculate the Composite Break-Even Point (in Sales Revenue):
Composite BEP (Sales) = Fixed Costs / Weighted Average Contribution Margin Ratio
Where the Weighted Average Contribution Margin Ratio can be calculated as: Weighted Average Contribution Margin / Weighted average Sales Price
-
-
Significance:
The composite break-even point helps multi-product businesses understand the overall sales volume required to cover all costs, considering the varying profitability of different products. It's crucial for businesses with diverse product portfolios to make informed decisions about pricing, product mix, and resource allocation.
-
Example:
Suppose a company sells two products, A and B.
Product Sales Mix Selling Price Variable Cost Contribution Margin A 60% $20 $10 $10 B 40% $30 $15 $15 Fixed costs are $50,000.
-
Weighted Average Contribution Margin: (0.60 * $10) + (0.40 * $15) = $12
-
Composite BEP (Units): $50,000 / $12 = 4,166.67 units (approximately 4,167 units)
This means the company needs to sell a combined total of approximately 4,167 units of products A and B to break even, considering the given sales mix. To find the individual break even number of units for each product, simply multiply the sales mix by the total composite break even units. For example, the break even units for product A is 4167 * 0.6 = 2500 units.
-
2. Cash Break-Even
The traditional break-even analysis considers all costs, including non-cash expenses like depreciation. The cash break-even point, on the other hand, focuses specifically on cash flows. It calculates the sales level required to cover all cash costs, ignoring non-cash expenses.
-
Calculation:
Cash BEP (Units) = (Fixed Costs - Depreciation) / Contribution per Unit
OR
Cash BEP (Sales) = (Fixed Costs - Depreciation) / P/V Ratio
-
Significance:
The cash break-even point is useful for assessing the short-term liquidity of a business. It shows the minimum sales level required to generate enough cash to meet immediate obligations, such as paying suppliers, employees, and rent. It's particularly relevant for startups or businesses facing financial difficulties, where cash flow is a primary concern.
-
Key Difference from Traditional BEP:
The key difference is the exclusion of non-cash expenses like depreciation from fixed costs. Depreciation is a book entry that reduces profit but doesn't involve an actual outflow of cash.
-
Example:
Suppose a company has fixed costs of $100,000, depreciation of $20,000, and a contribution margin per unit of $10.
Cash BEP (Units) = ($100,000 - $20,000) / $10 = 8,000 units
This means the company needs to sell 8,000 units to cover all its cash expenses. This is lower than the traditional break-even point because it doesn't include depreciation.
Margin of Safety (MOS)
The margin of safety represents the difference between actual or budgeted sales and the break-even sales. It indicates how much sales can decline before the business starts incurring losses.
-
Formulas:
MOS = Total Sales - Break-Even Sales
OR
MOS = Net Profit / P/V Ratio
Significance of Margin of Safety
-
Business Soundness: A large margin of safety indicates a healthy business. Even with a significant drop in sales, the business is likely to remain profitable.
-
Risk Assessment: A small margin of safety suggests higher risk. Even a small decline in sales can negatively impact profitability and potentially lead to losses.
-
Strength Indicator: The margin of safety serves as an indicator of the overall strength and resilience of the business. A higher MOS implies greater resilience to sales fluctuations.
No Comments