
Quality Costing
Quality Costing
In today's competitive market, quality is a key differentiator. Leading companies like Apple, Samsung, Toyota, Philips, and Ford use quality as a strategic tool to enhance customer satisfaction and gain a competitive edge. Quality, often defined as "fitness for use" (Dr. Juran), refers to the sum total of features and characteristics that satisfy stated or implied needs and wants. Companies strive to balance the costs of providing high-quality products with the value customers place on superior performance. This balance leads to expertise and long-term cost competitiveness.
Quality Costs (Cost of Quality - COQ)
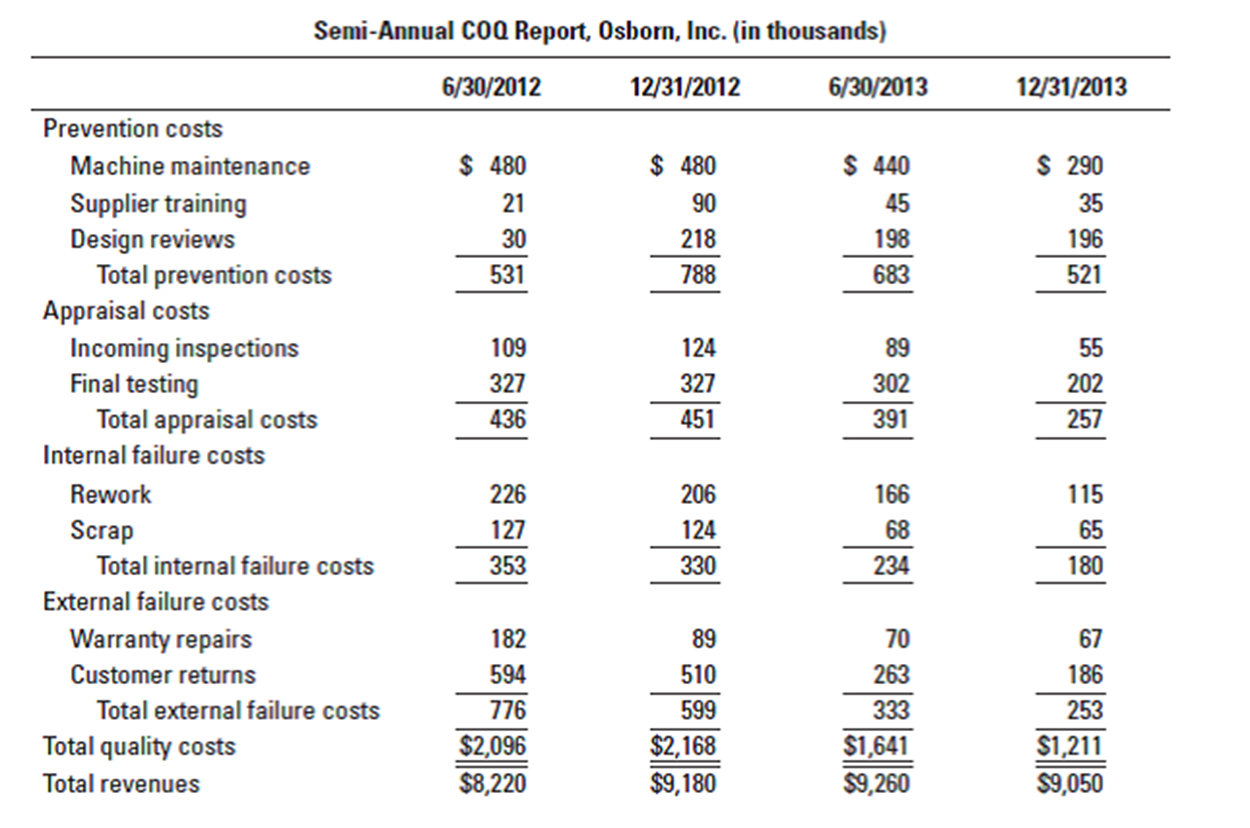
Quality cost, or cost of quality (COQ), represents the total cost a company incurs in preventing quality deficiencies and ensuring high-quality products. These costs are categorized into four main groups:
-
Prevention Costs: These costs are incurred to prevent products from falling outside acceptable quality standards. Examples include:
- Materials research
- Design and process innovations
- Employee training
- Quality planning
- Supplier quality management
-
Appraisal Costs: These costs are associated with determining whether products meet quality standards. They involve activities like:
- Random sampling
- Inspection
- Testing
- Quality audits
- Calibration of equipment
-
Internal Failure Costs: These costs arise from rectifying defective products before they are delivered to customers. Examples include:
- Reworking defective products
- Machine downtime due to quality issues
- Scrap
- Re-testing
-
External Failure Costs: These costs are incurred from correcting defective products after they have been delivered to customers. These are the most damaging costs and include:
- Warranty claims
- Product recalls
- Customer service related to quality issues
- Product liability claims
- Loss of reputation
In addition to these four categories, there's also the concept of opportunity cost or revenue foregone. This represents the potential revenue lost due to poor quality, such as lost sales, damaged brand reputation, and reduced customer loyalty. While difficult to quantify precisely, this cost should be considered.
Example
Quality Costing and its Benefits
Quality costing involves tracking and analyzing these costs to identify areas for improvement. The goal is to increase investment in prevention and appraisal costs (Conformance costs) to reduce the more expensive internal and external failure costs (Non-conformance costs). As investment in prevention and appraisal increases, internal and external failure costs should decrease, leading to overall cost savings and improved quality.
Quality costing helps managers:
- Identify and eliminate internal and external failure costs.
- Analyze the impact of poor quality on revenue and profits.
- Justify investments in quality improvement initiatives.
Non-Financial Measures of Quality
While financial measures are important, companies also track non-financial measures to assess their performance on quality and customer satisfaction. These measures include:
- Number of customer complaints
- Number of repeat orders
- Customer feedback (surveys, reviews)
- Number of order cancellations
- Market share
- Social media sentiment
Tracking these non-financial measures provides valuable insights into customer perceptions and helps identify areas where quality can be improved. High customer satisfaction, as reflected in these measures, typically leads to increased market share, brand loyalty, and lower quality costs. It's crucial to monitor both financial and non-financial measures to gain a complete understanding of quality performance.
Tools for Quality Control
Effective quality control relies on a variety of tools to monitor processes, identify defects, and drive continuous improvement. Here are some of the key tools used in quality control:
1. Control Charts
Control charts are a fundamental tool in statistical quality control. They visually represent how a process is performing over time by plotting sample measurements. The chart consists of:
- Average Line (Center Line): Represents the average measurement of the characteristic being monitored (e.g., average diameter of tubes).
- Upper Control Limit (UCL): The upper limit of acceptable variation from the average.
- Lower Control Limit (LCL): The lower limit of acceptable variation from the average.
-
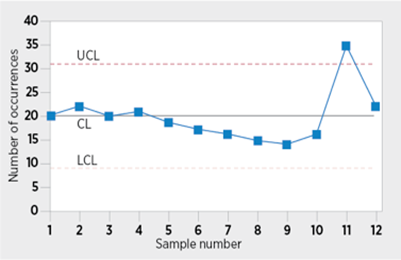

Each sample observation is plotted on the chart. If a significant number of observations fall outside the control limits, the process is considered "out of control" and requires investigation to identify and correct the underlying causes of the variation. Points outside the control limits signal potential problems in the process.
2. Pareto Diagrams
Pareto diagrams are used to prioritize improvement efforts by visually representing the frequency of different types of defects or problems. They combine a bar chart showing the frequency of each defect type with a line graph showing the cumulative percentage of defects. The defects are arranged in descending order of frequency, from the most frequent to the least frequent.
Pareto diagrams follow the Pareto principle (also known as the 80/20 rule), which states that roughly 80% of the effects come from 20% of the causes. In quality control, this often means that a small number of defect types account for the majority of problems. By focusing on addressing these "vital few" defects, companies can achieve the greatest quality improvements.
3. Cause and Effect (Fishbone) Diagrams
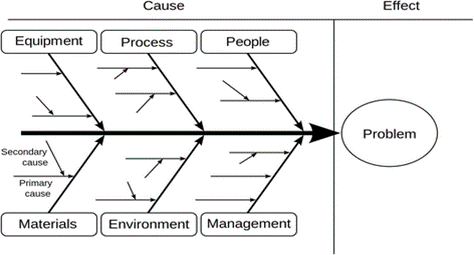
Cause and effect diagrams, also known as fishbone or Ishikawa diagrams, are used to systematically explore the potential causes of a specific problem or defect. The diagram resembles the skeleton of a fish, with the "head" of the fish representing the problem and the "bones" representing the various categories of potential causes.
The major categories of causes typically include:
- People: Lack of training, operator error, etc.
- Methods: Procedures, processes, work instructions, etc.
- Machines: Equipment, tools, technology, etc.
- Materials: Raw materials, components, etc.
- Environment: Temperature, humidity, lighting, etc.
- Measurement: Inspection methods, gauges, etc.
Each major category can be further broken down into more specific causes, creating a hierarchical structure that helps identify the root cause of the problem.
No Comments