
Investment Evaluation Techniques
Investment Evaluation Techniques (Detailed Analysis)
Investment evaluation techniques are essential for assessing the feasibility, profitability, and risk of capital projects. These methods help businesses determine whether an investment will generate adequate returns and align with financial objectives.
1. Payback Period
Concept
The payback period is the time it takes for an investment to recover its initial cost through cash inflows. It is a simple method that provides a quick assessment of how soon a business can expect to break even.
Formula
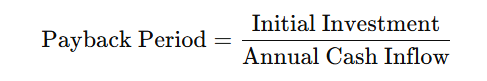
Example
If a company invests $10,000 in new equipment and expects to generate $5,000 per year in cash inflows, the payback period is:

Advantages
- Simple and easy to calculate.
- Useful for companies that prioritize liquidity and short-term investment recovery.
Limitations
- Ignores the time value of money (TVM).
- Does not consider cash flows beyond the payback period, which may lead to misleading investment decisions.
2. Discounted Payback Period
Concept
The discounted payback period improves upon the regular payback period by incorporating the time value of money. It discounts future cash flows to their present value before calculating how long it takes to recover the investment.
Formula

Example
If an investment of $10,000 generates $5,000 annually for three years at a discount rate of 10%, the discounted cash flows would be:
| Year | Cash Inflow | Discount Factor (10%) | Present Value |
|---|---|---|---|
| 1 | 5,000 | 0.909 | 4,545 |
| 2 | 5,000 | 0.826 | 4,130 |
| 3 | 5,000 | 0.751 | 3,755 |
Total discounted cash inflows after two years = $8,675, which does not yet recover the investment. After three years, the cumulative inflows exceed $10,000, so the discounted payback period is slightly less than three years.
Advantages
- Accounts for the time value of money.
- More accurate than the regular payback period in evaluating long-term investments.
Limitations
- More complex to calculate.
- Still ignores cash flows beyond the payback period.
3. Net Present Value (NPV)
Concept
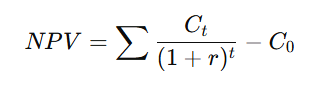
Net Present Value (NPV) is the difference between the present value of cash inflows and outflows, helping businesses assess the profitability of an investment in today’s dollars. A positive NPV means the project is expected to generate value, while a negative NPV suggests a loss.
Formula
Example
A company considers a $50,000 investment that will generate cash flows of $20,000 per year for three years at a discount rate of 10%.
| Year | Cash Flow | Discount Factor (10%) | Present Value |
|---|---|---|---|
| 1 | 20,000 | 0.909 | 18,180 |
| 2 | 20,000 | 0.826 | 16,520 |
| 3 | 20,000 | 0.751 | 15,020 |
Total Present Value of Cash Inflows = $49,720
NPV = $49,720 - $50,000 = -$280 (Investment should be rejected)
Advantages
- Considers all cash flows and time value of money.
- Provides a direct profitability measure in present value terms.
Limitations
- Requires estimation of discount rate, which can be subjective.
- More complex compared to payback methods.
4. Profitability Index (PI)
Concept
The Profitability Index (PI) measures the relationship between the present value of future cash inflows and the initial investment. It helps businesses compare different investment opportunities.
Formula
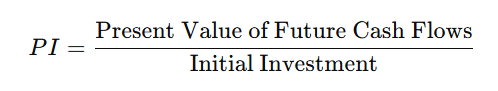
- If PI > 1, the project is profitable.
- If PI < 1, the project is not viable.
Example
Using the previous NPV example, where the present value of cash inflows is $49,720 and the initial investment is $50,000:
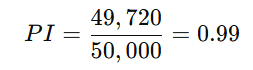
Since PI < 1, the investment is not favorable.
Advantages
- Useful for ranking projects when capital is limited.
- Accounts for the time value of money.
Limitations
- Does not provide absolute dollar value like NPV.
- Sensitive to cash flow estimates.
5. Internal Rate of Return (IRR)
Concept
The Internal Rate of Return (IRR) is the discount rate at which NPV = 0. It represents the expected annual return of an investment.
Formula
IRR is found by solving:
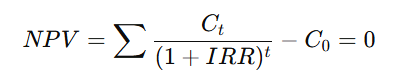
Since IRR is not solved algebraically, it requires trial-and-error or financial software.
Example
A company invests $40,000 in a project with cash inflows of $15,000 per year for three years. Using calculations or a financial calculator, IRR is found to be 13.2%.
Advantages
- Provides a percentage return, making comparisons easier.
- Considers the time value of money.
Limitations
- Complex calculation requiring software or financial models.
- Can give misleading results for non-conventional cash flows (multiple sign changes in cash flows).
Comparison of Investment Evaluation Techniques
| Technique | Time Value of Money? | Simplicity | Use Case | Key Limitation |
|---|---|---|---|---|
| Payback Period | No | Very Simple | Quick assessment | Ignores cash flows after payback |
| Discounted Payback Period | Yes | Complex | More accurate payback estimation | Ignores cash flows after payback |
| Net Present Value (NPV) | Yes | Complex | Best for determining overall profitability | Requires discount rate estimation |
| Profitability Index (PI) | Yes | Moderate | Ranking multiple projects | Not ideal for standalone project decisions |
| Internal Rate of Return (IRR) | Yes | Complex | Expresses return as a percentage | Multiple IRRs possible for unconventional cash flows |
Conclusion
- Each investment evaluation technique has strengths and weaknesses.
- Payback methods are useful for quick liquidity assessments but ignore profitability over time.
- NPV and IRR provide comprehensive profitability insights but require accurate discount rate estimation.
- Profitability Index helps in capital rationing but does not show absolute profit values. Businesses should use a
- combination of these techniques to make well-informed investment decisions.
No Comments