
Altman’s Z-Score
Altman's Z-Score model is a numerical measurement used to predict the probability of a business going bankrupt within the next two years. Developed by Edward Altman in 1968, it combines multiple financial ratios to assess financial stability. It's an effective method for gauging financial distress using balance sheet and income statement data.
Overview
- Purpose: Predict the likelihood of bankruptcy within two years.
- Developer: Edward Altman (1968).
- Core Idea: Businesses experienced a sharp rise in incidences of default (Great Depression)
- Accuracy: Historically, the model had ~72% accuracy in predicting bankruptcy two years beforehand, with a ~6% false positive rate. One year prior, accuracy went down to with false positive rate 15% to 20%
-
Adaptability: Altman created the original model for public manufacturing companies with assets over $1 million. Later versions were adapted for:
- Private Manufacturing Companies (Model A)
- Non-Publicly Traded Companies (Model B)
The Z-Score Formula
The core Z-Score is calculated using five key financial ratios:
Z = 1.2A + 1.4B + 3.3C + 0.6D + 1.0E
Where:
- Z = Altman's Z-Score
- A = Working Capital / Total Assets
- B = Retained Earnings / Total Assets
- C = Earnings Before Interest and Tax (EBIT) / Total Assets
- D = Market Value of Equity / Total Liabilities
- E = Sales / Total Assets
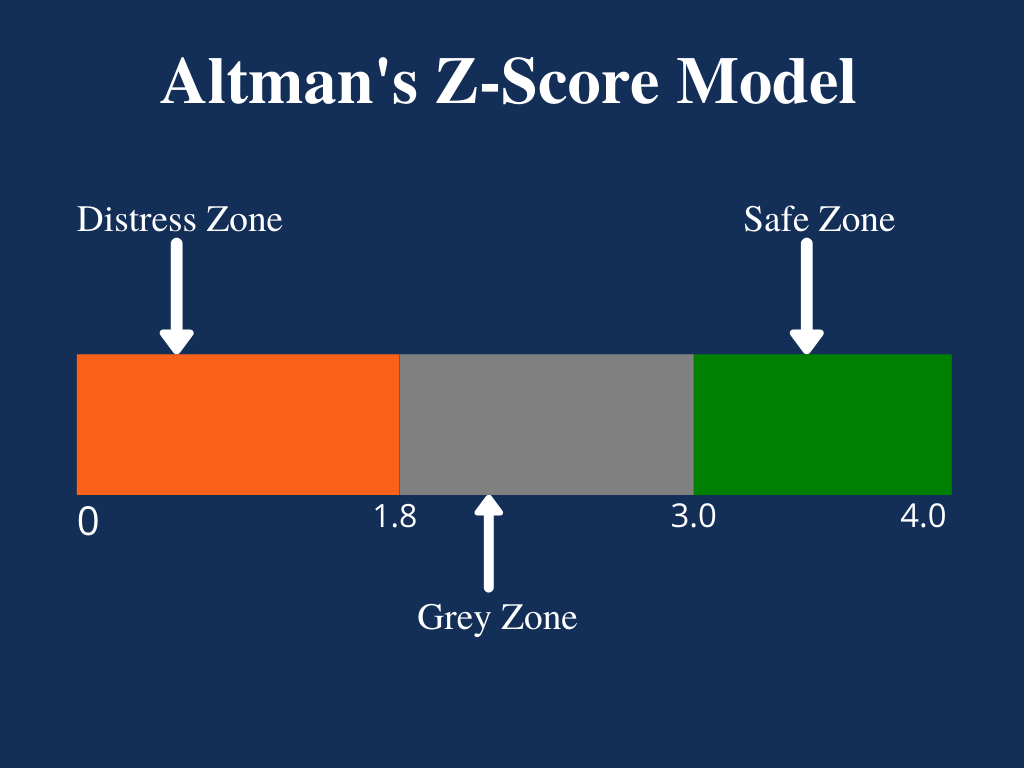
Understanding Z-Score Results
The Z-Score provides a risk assessment:
- Z < 1.8: Company is in financial distress and has a high probability of bankruptcy.
- 1.8 < Z < 3.0: Company is in a "grey area" with a moderate chance of bankruptcy.
- Z > 3.0: Company is in a "safe zone" and is unlikely to file for bankruptcy.
Application for Investors
Investors use the Z-score to:
-
Make buy/sell decisions:
- A high Z-score may signal a buy opportunity.
- A low Z-score may signal a sell to avoid potential losses.
- Assess risk: Gauge the financial health of a company before investing.
The Five Financial Ratios Explained
Here's a closer look at each of the financial ratios used in the Z-Score:
-
Working Capital / Total Assets (A):
- What it measures: A company's short-term liquidity and operational efficiency.
-
Interpretation:
- Positive WC: Can meet short-term obligations and has funds for investment.
- Negative WC: Struggles to meet short-term obligations.
-
Retained Earnings / Total Assets (B):
- What it measures: A company's cumulative profitability and ability to finance growth from internal sources.
-
Interpretation:
- High Ratio: Finances expenditure using retained earnings
- Low Ratio: Relies on borrowed fund; has problems generating profits; increases the probability of a company going bankrupt
-
Earnings Before Interest and Taxes (EBIT) / Total Assets (C):
- What it measures: A company's operational profitability, excluding the impact of financing and taxes.
- Interpretation: EBIT/Total Assets demonstrates a company’s ability to generate enough revenues to stay profitable and fund ongoing operations and make debt payments.
-
Market Value of Equity / Total Liabilities (D):
- What it measures: The company's leverage and how well equity can cover total liabilities.
- Interpretation: A high investor confidence means high market value of equity to total liabilities ratio
-
Sales / Total Assets (E):
- What it measures: The efficiency of the management to produce sales in assets
- Interpretation:
- High ratio needs small investment to generate sales increasing profits
- Low or falling ratio needs use more resources meaning lowers profitability
Okay, let's walk through an example of calculating Altman's Z-Score and interpreting the results.
Example: Hypothetical "TechGrowth Inc."
Let's assume "TechGrowth Inc." has the following financial information (in millions of dollars):
- Working Capital (A): $50
- Retained Earnings (B): $100
- EBIT (C): $30
- Market Value of Equity (D): $200
- Sales (E): $250
- Total Assets: $400
- Total Liabilities: $150
Step 1: Calculate the Ratios
- A (Working Capital/Total Assets): $50 / $400 = 0.125
- B (Retained Earnings/Total Assets): $100 / $400 = 0.25
- C (EBIT/Total Assets): $30 / $400 = 0.075
- D (Market Value of Equity/Total Liabilities): $200 / $150 = 1.33
- E (Sales/Total Assets): $250 / $400 = 0.625
Step 2: Apply the Z-Score Formula
Z = 1.2A + 1.4B + 3.3C + 0.6D + 1.0E Z = (1.2 * 0.125) + (1.4 * 0.25) + (3.3 * 0.075) + (0.6 * 1.33) + (1.0 * 0.625) Z = 0.15 + 0.35 + 0.2475 + 0.798 + 0.625 Z = 2.1705
Step 3: Interpret the Result
The calculated Z-Score for TechGrowth Inc. is 2.1705.
Based on Altman's Z-Score interpretation:
- 1.8 < Z < 3.0: Company is in a "grey area" with a moderate chance of bankruptcy.
Conclusion:
TechGrowth Inc. falls into the "grey area." This means there's a moderate level of financial distress. The company is not in immediate danger of bankruptcy, but investors should be cautious. The should further examine TechGrowth to evaluate whether it would be a worthy investment.
No Comments