
Techniques of Financial Statement Analysis
1. Common Size Statements
Concept: Presents all items in a financial statement as a percentage of a common base figure. This allows for easier comparison across different time periods or companies of different sizes. It neutralizes the impact of size differences.
Formats & Examples:
a) Common Size Income Statement: Each line item is expressed as a percentage of Net Sales.
Hypothetical Common-Size Income Statement
| Item | 2003 | 2002 | 2001 |
|---|---|---|---|
| Sales | 100% | 100% | 100% |
| Cost of Sales | 65% | 68% | 70% |
| Gross Profit | 35% | 32% | 30% |
| Expenses | 27% | 27% | 26% |
| Taxes | 2% | 1% | 1% |
| Profit | 6% | 4% | 3% |
b) Common Size Balance Sheet: Each line item is expressed as a percentage of Total Assets (or Total Liabilities).
Common Size Balance Sheet Ratios of ABC Industries Ltd (Partial Example)
| Year | 2003-04 | 2002-03 | 2001-02 | ... |
|---|---|---|---|---|
| SOURCES OF FUNDS | ||||
| Share Capital | 2.78 | 2.27 | 4.23 | ... |
| Reserves & Surplus | 57.80 | 56.99 | 55.07 | ... |
| Total Shareholders Funds | 60.59 | 59.26 | 59.30 | ... |
| Secured Loans | 23.49 | 30.54 | 16.34 | ... |
| ... | ... | ... | ... | ... |
| Total Liabilities | 100.00 | 100.00 | 100.00 | ... |
Common Size Balance Sheet Ratios of ABC Industries Ltd (Partial Example) Common Size Balance Sheet Ratios of ABC Industries Ltd (Partial Example)
| Year | 2003-04 | 2002-03 | 2001-02 | . |
|---|---|---|---|---|
| SOURCES OF FUNDS | ||||
| Share Capital | 2.78 | 2.27 | 4.23 | |
| Reserves & Surplus | 57.80 | 56.99 | 55.07 | |
| Total Shareholders Funds | 60.59 | 59.26 | 59.30 | |
| Secured Loans | 23.49 | 30.54 | 16.34 | |
| Total Liabilities | 100.00 | 100.00 | 100.00 |
Usefulness:
- Identifies changes in the relative importance of different items.
- Facilitates comparison across different sized companies.
- Highlights trends that might not be obvious in raw numbers.
2. Comparative Statements
Concept: Compares financial statement data over multiple periods (e.g., years). It shows both the absolute changes and percentage changes over time, helping to identify trends and areas of improvement or decline.
Format and Example:
XYZ Company Comparative Income Statement (Partial Example)
| (Rs. in Thousands) | Audited 1999 | Audited 2000 | Audited 2001 | Audited 2002 | Audited 2003 | Industry Average |
|---|---|---|---|---|---|---|
| Rs. | % | Rs. | % | Rs. | % | |
| Sales | 33,013.0 | 100.0 | 33,395.0 | 100.0 | 37,021.0 | 100.0 |
| Cost of Sales | 19,305.0 | 58.5 | 19,891.0 | 59.6 | 21,836.0 | 59.0 |
| Gross Profit | 13,708.0 | 41.5 | 13,504.0 | 40.4 | 15,185.0 | 41.0 |
| Operating Expenses | 12,875.0 | 39.0 | 12,516.0 | 37.5 | 13,728.0 | 37.1 |
| Operating Profit | 833.0 | 2.5 | 2.9 | 1,457.0 | 3.9 |
Usefulness:
- Identifies trends in sales, expenses, and profits.
- Shows if the company is growing, stagnating, or declining.
- Helps in forecasting future performance.
3. Trend Analysis (Time Series Analysis)
Concept: Examines financial data over a long period (many years) to identify patterns or trends. This involves calculating changes over time and often uses index numbers to smooth out large fluctuations. It is often used in combination with comparative analysis.
Format and Example:
Index numbers are calculated using a base year and each year is calculated as a percentage of that base year
Hypothetical Example
| Item | 2001 | 2002 | 2003 |
|---|---|---|---|
| Sales | 100,000 | 150,000 | 175,000 |
| Index-Number Trend | 100% | 150% | 175% |
Usefulness:
- Reveals long-term growth or decline patterns.
- Identifies cyclical changes in the business.
- Provides insights into the impact of long-term decisions.
- Can be used to predict future values of items using past trends.
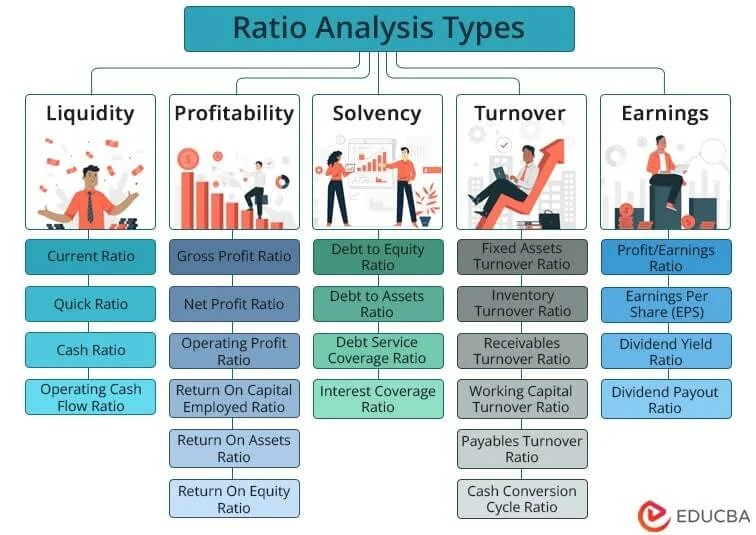
4. Ratio Analysis
Concept: Calculates ratios from financial statement data to evaluate various aspects of a company's performance, liquidity, solvency, and profitability. Ratios compare one data point to another to create a more understandable measure.
Categories of Ratios:
a) Liquidity Analysis Ratios:
-
Current Ratio: Measures a company's ability to pay its short-term obligations.
-
Formula:
Current Assets / Current Liabilities - General interpretation: A ratio of 1.5 or higher is often considered healthy.
-
Formula:
-
Quick Ratio (Acid-Test Ratio): A more conservative liquidity measure, excluding inventory.
-
Formula:
(Current Assets - Inventories) / Current LiabilitiesorQuick Assets / Current Liabilities - General interpretation: A ratio of 1:1 is generally satisfactory.
-
Formula:
-
Net Working Capital Ratio: Measures the ability to pay bills.
-
Formula:
Net Working Capital / Total Assets. - Where: Net Working Capital = Current assets - Current Liabilities.
- General interpretation: A ratio of 2:1 is often desirable.
-
Formula:
b) Profitability Analysis Ratios:
-
Gross Profit Margin: Indicates the profitability of core business operations.
-
Formula:
(Gross Profit / Net Sales) * 100
-
Formula:
-
Net Profit Margin: Shows overall profitability after all expenses and taxes.
-
Formula:
(Net Profit after Taxes / Net Sales) * 100
-
Formula:
-
Operating Profit Margin: Measures profitability from day-to-day operations.
-
Formula:
(Operating Profit / Sales) * 100
-
Formula:
-
Operating Ratio: Measures operating expenses as a proportion of sales.
-
Formula:
(Cost of goods sold + Operating expenses)/Sales * 100
-
Formula:
c) Profitability in Relation to Capital Employed (Investment):
-
Return on Capital Employed (ROCE): How well the company uses its capital to generate profits.
-
Formula:
(Net Operating Profit / Capital Employed) * 100 - Net operating profit = Profit Before Interest and tax
-
Formula:
-
Return on Shareholders' Equity: Profitability from the perspective of shareholders.
-
Formula:
(Net Profit after Tax and Preference Dividends / Shareholders' Equity) * 100
-
Formula:
-
Earnings per Share (EPS): The profit allocated to each share.
-
Formula:
(Net Profit after Tax -Preference Dividend) / Number of Equity Shares
-
Formula:
d) Activity Analysis Ratios:
-
Assets Turnover Ratio: Measures how efficiently a company uses its assets to generate revenue.
-
Formula:
Sales/Average Total Assets - Where: Average Total Assets = (Beginning Total Assets + Ending Total Assets) / 2
-
Formula:
-
Accounts Receivable Turnover Ratio: Measures how quickly a company collects on its credit sales.
-
Formula:
Sales/Average Accounts Receivable
-
Formula:
-
Inventory Turnover Ratio: Measures how quickly a company turns its stock.
-
Formula:
Cost of goods sold / Average Inventories
-
Formula:
e) Long-Term Solvency Ratios:
-
Debt-Equity Ratio: Shows the company's reliance on debt vs. equity financing.
-
Formula:
Long-Term Debt / Owners' Equity -
OR
Total Debt / Owners' Equity
-
Formula:
-
Proprietary Ratio (Equity Ratio): Shows the proportion of total assets that belong to shareholders
-
Formula:
Proprietors' Funds / Total Assets
-
Formula:
-
Capital Gearing Ratio: Shows the mix of equity capital with fixed interest funds.
-
Formula:
Equity Capital including Reserves and Surplus / Fixed Dividend and Interest bearing securities
-
Formula:
f) Coverage Ratios:
-
Interest Coverage Ratio: Measures a company's ability to cover interest expense from its earnings.
-
Formula:
Net Profit before Interest and Taxes/ Interest Charges
-
Formula:
-
Dividend Coverage Ratio: Measures the capacity to cover Preference dividend.
-
Formula:
Net Profit after Interest and Taxes/ Preference Dividend
-
Formula:
-
Total Coverage Ratio: Measures the ability to cover interest and pref dividend from earning.
-
Formula:
Net Profit before Interest and Taxes/Total Fixed Charges - Where: Total Fixed Charges = Interest + Pref. Dividend
-
Formula:
Usefulness of Ratio Analysis:
- Assess a company's liquidity, solvency, profitability, and efficiency.
- Compare performance over time and against competitors.
- Identify strengths and weaknesses in financial position and operational efficiency.
4. Net Working Capital Analysis
Concept: Net working capital (NWC) is a measure of a company's liquidity and its ability to meet short-term obligations. Analyzing trends in NWC can reveal how effectively a company is managing its current assets and liabilities.
Calculation: Net Working Capital (NWC) = Current Assets - Current Liabilities
Components:
- Current Assets: Cash, accounts receivable, inventory, marketable securities, prepaid expenses.
- Current Liabilities: Accounts payable, salaries payable, short-term debt, unearned revenue, accrued expenses.
Analysis & Example:
-
Calculate NWC for multiple periods:
Year Current Assets Current Liabilities NWC 2021 $500,000 $300,000 $200,000 2022 $550,000 $320,000 $230,000 2023 $600,000 $350,000 $250,000 -
Interpret the trend:
- Increasing NWC (as in the example): Generally indicates improved liquidity and a greater ability to cover short-term obligations. In our example, we can see an increasing positive trend in NWC
Usefulness:
- Liquidity Assessment: NWC is a primary indicator of a company's short-term financial health.
- Operational Efficiency: Changes in NWC can reflect improved or declining efficiency in managing inventory, receivables, and payables.
- Investment and Financing Decisions: NWC is critical in managing risk and taking advantage of investment opportunities
5. Cash Flow Analysis
Concept: Examines the movement of cash both in and out of a company over a period. It's not just about profit, but rather how a company generates and uses cash. Crucial to determine liquidity and long-term solvency.
Categories of Cash Flows:
-
Cash Flow from Operating Activities (CFO): Cash generated from the company's day-to-day business activities.
- Direct Method (rare): Summing actual cash inflows and outflows.
- Indirect Method (common): Adjusting net income for non-cash items and changes in working capital.
-
Cash Flow from Investing Activities (CFI): Cash flows related to buying or selling long-term assets like property, plant, and equipment (PP&E), and investments.
-
Cash Flow from Financing Activities (CFF): Cash flows related to borrowing, repaying debt, issuing or repurchasing stock, and paying dividends.
Format & Example :
| Item | 2023 | 2022 |
|---|---|---|
| Cash Flow from Operating Activities | ||
| Net Income | $100 | $80 |
| Depreciation | $20 | $15 |
| Change in Accounts Receivable | -$10 | -$5 |
| Change in Inventory | -$5 | -$2 |
| Change in Accounts Payable | $8 | $3 |
| Net Cash from Operations (CFO) | $113 | $91 |
| Cash Flow from Investing Activities | ||
| Purchase of Equipment | -$50 | -$30 |
| Sale of Investments | $10 | $5 |
| Net Cash from Investing (CFI) | -$40 | -$25 |
| Cash Flow from Financing Activities | ||
| Issuance of Debt | $30 | $20 |
| Repayment of Debt | -$15 | -$10 |
| Dividends Paid | -$5 | -$2 |
| Net Cash from Financing (CFF) | $10 | $8 |
| Net Increase (Decrease) in Cash | $83 | $74 |
| Beginning Cash Balance | $50 | $30 |
| Ending Cash Balance | $133 | $104 |
Analysis & Interpretation:
- Positive CFO: Indicates a company can generate sufficient cash from its core operations. A rising CFO over time is a very positive sign.
- Negative CFI: Often indicates investments in the company's future, which can be positive in the long run. However, large or persistent negative CFI needs scrutiny. Selling off investments or assets could cause this and indicates that the company is in trouble
- Positive CFF: Often indicates the company is raising capital through debt or equity. A positive trend is not inherently good or bad
- Negative CFF: Might mean the company is paying down debt, repurchasing stock, or paying dividends, which can be positive but needs to be seen in context.
- Trend Analysis: Look for trends in each category of cash flow over several periods to assess the consistency and sustainability of the company's cash generation.
Usefulness:
- Liquidity Assessment: Crucial for understanding a company's ability to meet its short-term obligations.
- Solvency Assessment: Important to see if the company can cover its long-term debts.
- Investment Analysis: It is important to know what and why the business invested
- Operational Health: Positive and growing operating cash flow is a strong indicator of a healthy business.
- Fraud Detection: Cash flow analysis can help detect irregularities or unusual patterns that might indicate financial manipulation.
No Comments