
EBIT-EPS Analysis
EBIT-EPS analysis is a tool to help companies compare different financing options (equity, debt, preference shares) and their impact on earnings per share (EPS) under various EBIT scenarios. The goal is to identify the financing plan that maximizes EPS for the expected level of EBIT.
The Basic Idea
Companies can raise funds in different ways and in different proportions:
- Equity only
- Debt only
- A combination of debt and equity
- Preference shares
- **A combination of all sources
The method that would ensure the largest EPS given the levels of earnings will be most helpful.
By comparing alternative sources of funding for various EBIT, EPS will be impacted: Which means the source of funds used to finance investment has a great impact.
Key Concepts
- Financial Plans: Different ways a company can finance its investment needs (e.g., all equity, debt and equity, all debt, etc.).
- EBIT (Earnings Before Interest and Taxes): A company's operating profit before accounting for interest expenses or income taxes.
- EPS (Earnings Per Share): Net income available to common shareholders divided by the number of outstanding shares.
- Financial Break-Even Point (BEP): The EBIT level at which EPS is zero. It's the level needed to just cover fixed financial charges.
- Indifference Point (IP): The EBIT level at which two financing plans result in the same EPS. It helps determine when one plan becomes more advantageous than another.
- Tax deductibility of interest: Interest is tax-deductible while preference is not. Because of the tax deductibility, debt in many cases has an edge over preference.
The EBIT-EPS Analysis Process
- Identify Financing Alternatives: Determine the different ways the company can raise the required funds (e.g., issue new equity, take on debt, issue preference shares).
- Calculate EPS for Each Plan: Project EPS for each financing plan under a range of possible EBIT levels.
-
Determine the Financial Break-Even Point (BEP): Financial Break-even point = I + (DP/1 – t)
where
- I = Annual interest charges,
- DP = Preference dividend, and
- t = Tax rate
- Find the Indifference Point (IP): Calculate the EBIT level at which two financing plans yield the same EPS. Use formulas to find the indifference point between plans.
-
Analyze the Results:
- Below the IP: The plan with lower fixed costs (usually equity) is better.
- Above the IP: The plan with higher fixed costs (usually debt) is better.
- Consider the company's risk tolerance and forecasts for future EBIT.
Formulas for Indifference Point Analysis
The indifference point (X = EBIT at the indifference point) between two methods of financing can be computed using the following formulas:
-
Equity vs. Debt:
(X - I1) * (1 - t) / N1 = (X - I2) * (1 - t) / N2 -
Equity vs. Preference Shares:
(X * (1 - t) - Dp) / N1 = (X * (1 - t)) / N2
Interpreting the Results
- If expected EBIT is above the IP: Choose the financing plan with higher financial leverage (debt or preferred stock) to maximize EPS.
- If expected EBIT is below the IP: Choose the financing plan with lower financial leverage (equity) to minimize risk.
Example: Financial Plan Selection
Suppose a firm has a capital structure exclusively comprising of ordinary shares amounting to Rs 10,00,000. The firm now wishes to raise additional Rs 10,00,000 for expansion. The firm has four alternative financial plans: (A) It can raise the entire amount in the form of equity capital. (B) It can raise 50 per cent as equity capital and 50 per cent as 5% debentures. (C) It can raise the entire amount as 6% debentures. (D) It can raise 50 per cent as equity capital and 50 per cent as 5% preference capital. Further assume that the existing EBIT are Rs 1,20,000, the tax rate is 35 per cent, outstanding ordinary shares 10,000 and the market price per share is Rs 100 under all the four alternatives.
To determine which plan should be used, we need to calculate the break even points.
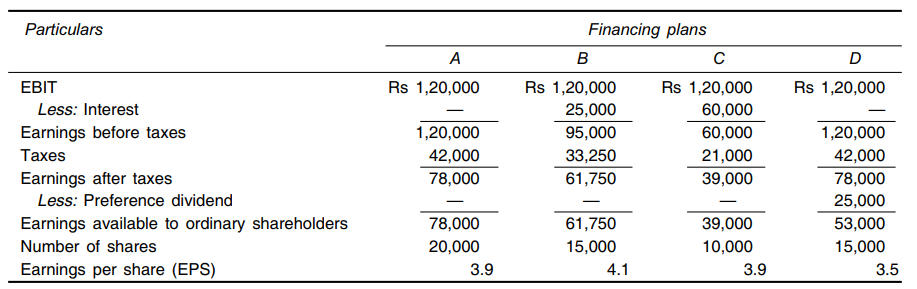 The calculations in Table reveal that given a level of EBIT of Rs 1,20,000, the financing alternative B, which involves 50 per cent ordinary shares and 50 per cent debt, is the most favourable with respect to EPS. Another disclosure of the table is that although the proportion of ordinary shares in the total capitalisation under the financing plan D is also 50 per cent, that is, equal to plan B, EPS is considerably different (lowest). The difference in the plans B and D is due to the fact that interest on debt is tax-deductible while the dividend on preference shares is not. With 35 per cent income tax, the explicit cost of preference shares would be higher than the cost of debt.
Table also indicates that the annual before-tax costs of the various financing plans are:
Financing Plan B Rs 25,000
Financing Plan C 60,000
Financing Plan D (Rs 25000/1 – 0.35) 38,462
Financial BEP is the level of EBIT which is equal to firm’s fixed financial costs.
Benefits of EBIT-EPS Analysis
- Clear Visualization: Easy to see the relationship between different financial plans, EBIT levels, and EPS.
- Informed Decision-Making: Helps companies make more informed financing decisions.
- Communication Tool: Facilitates communication with investors and stakeholders.
Limitations
- Simplified Model: Does not account for all factors that influence financing decisions (e.g., market conditions, financial flexibility).
- Static Analysis: Only considers a limited number of EBIT levels.
- Ignores Market Prices: Focuses on EPS, but doesn't consider how financing choices might impact the market price of the stock.
Conclusion
EBIT-EPS analysis is a valuable tool for evaluating financing alternatives and their potential impact on shareholder value. By considering different EBIT scenarios and calculating the indifference points, companies can make more informed decisions about how to finance their operations and investments. The main goal is to choose which financing plan maximizes EPS.
No Comments