
Net Income Approach
The Net Income (NI) Approach, proposed by Durand, suggests that a company's capital structure (the mix of debt and equity) significantly impacts its valuation. This means that changing the amount of debt a company uses (financial leverage) will affect the overall cost of capital and the total value of the company.
Key Ideas of the NI Approach
- Leverage Matters: Changes in financial leverage directly affect a company's overall cost of capital and total value.
- Increase in Leverage = Increase in Value: As a company increases its debt (leverage), its weighted average cost of capital (WACC) decreases, and its total value and share price increase.
- Decrease in Leverage = Decrease in Value: Conversely, reducing debt leads to a higher cost of capital and a lower company value and share price.
- Optimal Leverage: According to this theory, a company can find an ideal capital structure where its value is maximized, and the cost of capital is minimized.
Assumptions of the NI Approach
The NI Approach is based on these critical assumptions:
- No Taxes: Corporate income taxes are ignored.
- Cost of Debt < Cost of Equity: The cost of borrowing (interest rate) is always lower than the return required by equity investors.
-
Risk Perception Unchanged: The use of debt doesn't alter how investors perceive the company's risk. This means that the cost of debt and the cost of equity remain constant regardless of the level of debt.
- Implication: As leverage increases, the company uses more of the cheaper source of financing (debt) in its capital structure. This drives down the weighted average cost of capital, thus increasing the total value.
How Leverage Impacts Value Under NI Approach
- Higher Leverage = Higher EPS and Share Price: As leverage increases, the proportion of debt (which is cheaper) in the capital structure increases. This results in an increase in earnings for the shareholders and, hence, the market value of the equity shares.
- Optimal Point: An ideal structure has the highest total company value and the lowest overall cost of capital, which also corresponds to the maximum market price per share.
- No Debt (Zero Leverage): If a company has no debt, its overall cost of capital is equal to the cost of equity.
- 100% Debt: As leverage increases, the WACC decreases, approaching the cost of debt if leverage reaches 100%.
Example: Impact of Leverage on Company Value (NI Approach)
Let's look at the example in the text:
Initial Situation
- EBIT (Earnings Before Interest & Taxes): Rs 50,000
- Debt (B): Rs 200,000 with a 10% interest rate (ki = 0.10)
- Cost of Equity (ke): 12.5% (0.125)
| Item | Amount |
|---|---|
| Net Operating Income (EBIT) | Rs 50,000 |
| Less: Interest on Debentures (I) | Rs 20,000 |
| Earnings available to equity holders (NI) | Rs 30,000 |
| Equity capitalisation rate (ke) | 0.125 |
| Market value of equity (S) = NI/ke | Rs 240,000 |
| Market value of debt (B) | Rs 200,000 |
| Total value of the firm (S + B) = V | Rs 440,000 |
| Overall cost of capital (k0) = EBIT/V | 11.36% |
Increase in Debt
The company increases debt by Rs 100,000 and uses it to retire equity shares.
- Debt (B): Now Rs 300,000
- ki and ke: Remain unchanged according to the NI Approach
| Item | Amount |
|---|---|
| Net Operating Income (EBIT) | Rs 50,000 |
| Less: Interest on Debentures (I) | Rs 30,000 |
| Earnings available to equity holders (NI) | Rs 20,000 |
| Equity capitalisation rate (ke) | 0.125 |
| Market value of equity (S) = NI/ke | Rs 160,000 |
| Market value of debt (B) | Rs 300,000 |
| Total value of the firm (S + B) = V | Rs 460,000 |
| Overall cost of capital (k0) | 10.9% |
- Result: Total value of the firm has increased and the overall cost of capital has decreased with higher debt.
Decrease in Debt
The company reduces debt by Rs 100,000, raising equity to retire debt.
- Debt (B): Now Rs 100,000
- ki and ke: Remain unchanged according to the NI Approach
| Item | Amount |
|---|---|
| Net Operating Income (EBIT) | Rs 50,000 |
| Less: Interest on Debentures (I) | Rs 10,000 |
| Earnings available to equity holders (NI) | Rs 40,000 |
| Equity capitalisation rate (ke) | 0.125 |
| Market value of equity (S) = NI/ke | Rs 320,000 |
| Market value of debt (B) | Rs 100,000 |
| Total value of the firm (S + B) = V | Rs 420,000 |
| Overall cost of capital (k0) | 11.9% |
- Result: Total value of the firm has decreased and the overall cost of capital has increased with lower debt.
Impact on Market Price Per Share
- Initial Situation (Debt = Rs 200,000): 2,400 shares outstanding, price per share: Rs 100
- Increased Debt (Debt = Rs 300,000): 1,400 shares, total equity value is Rs 160,000, price per share: Rs 114.28 (increased)
- Decreased Debt (Debt = Rs 100,000): 3,400 shares, total equity value is Rs 320,000, price per share: Rs 94.12 (decreased)
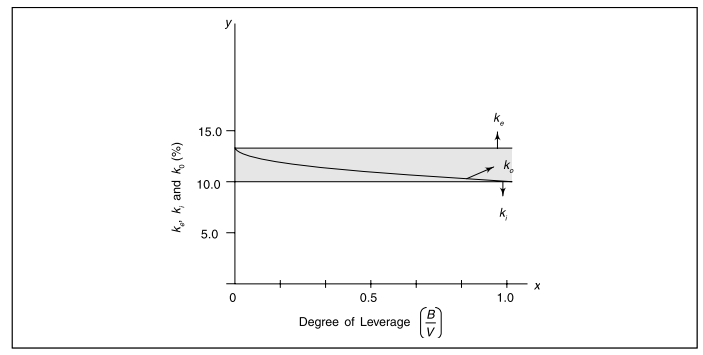
Graphical Representation
-
X-axis: Degree of leverage (B/V)
-
Y-axis: Cost of Capital percentages (ki, ke, k0)
-
ki and ke are horizontal lines, as they are assumed to remain constant with changes in leverage.
-
k0 decreases as the degree of leverage increases, approaching ki as leverage reaches 100% (when all capital is debt).
Conclusion of the NI Approach
The NI Approach suggests that companies can maximize their value by using almost 100% debt in their capital structure. As the level of debt increases, the weighted average cost of capital decreases and approaches the cost of debt, resulting in an increase in the value of the firm and the share price.
No Comments