
Economic Analysis
Leading, Lagging & Coincident Macroeconomic Indicators
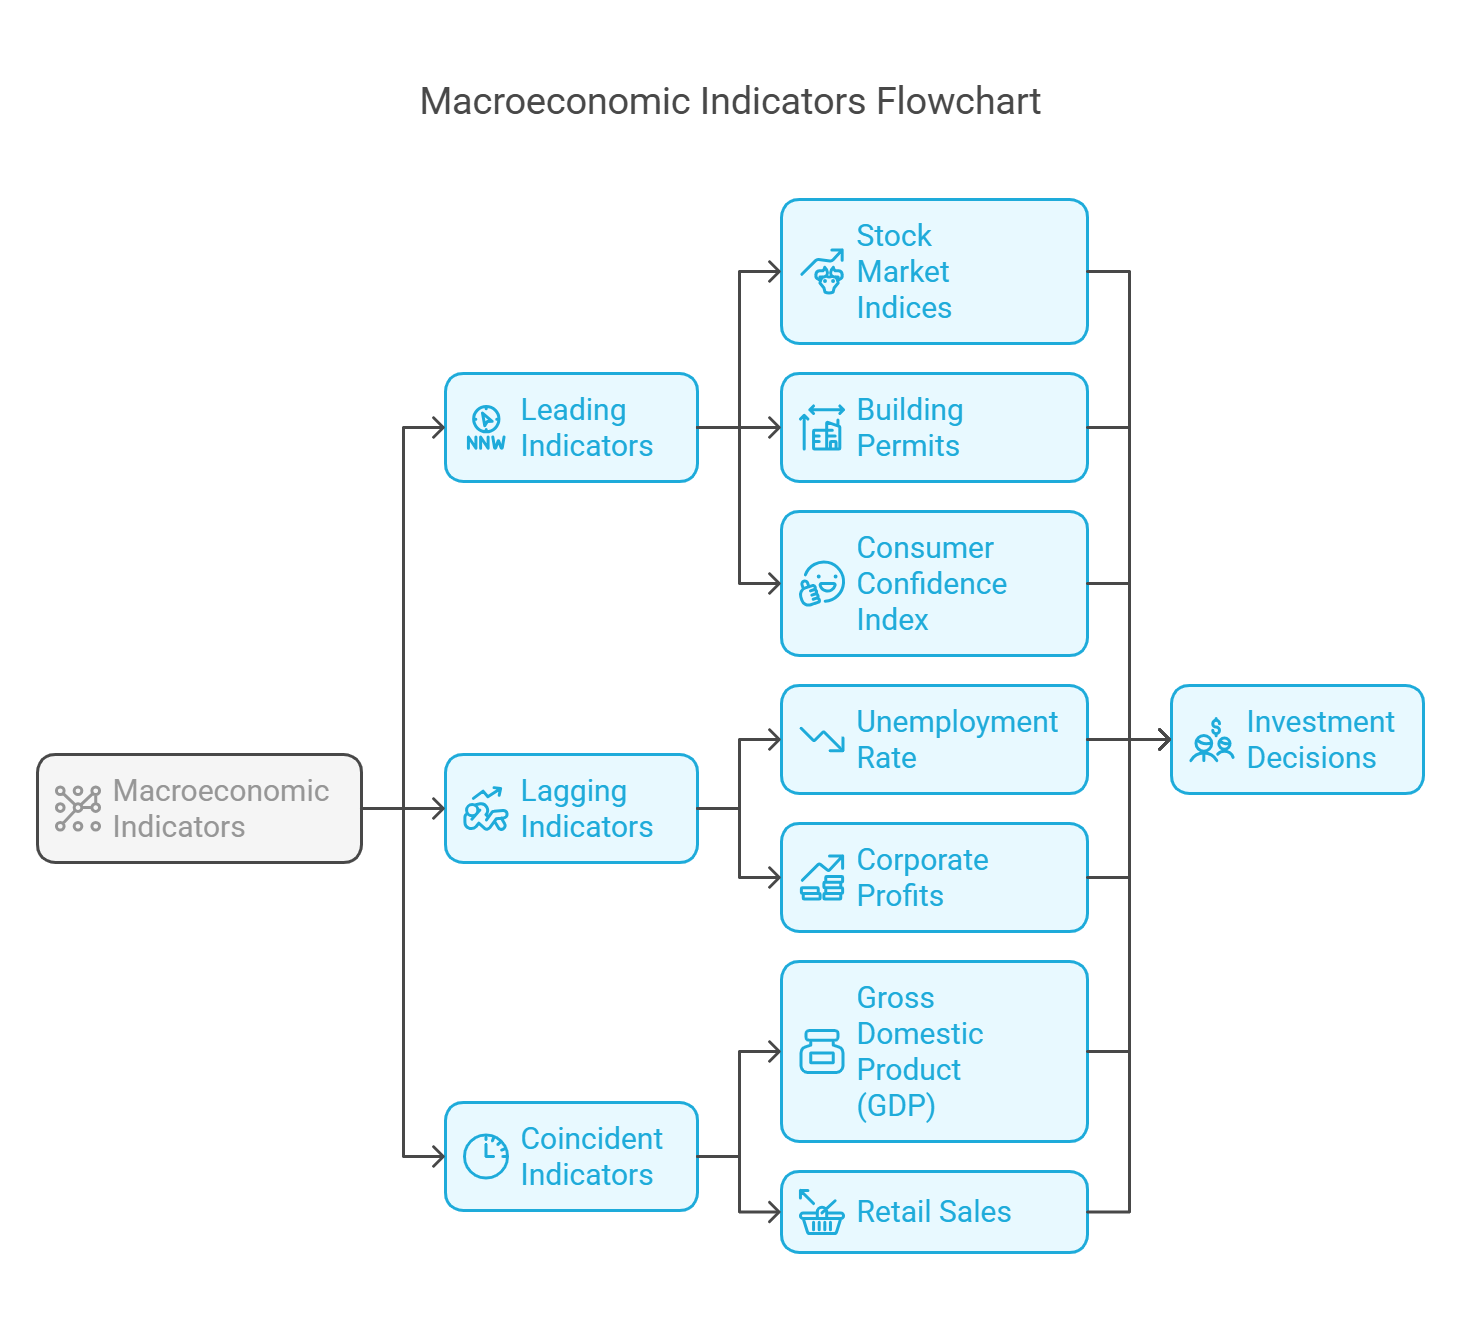
Core Concept: Macroeconomic indicators provide insights into the current and future state of the economy. These indicators are classified into three main types: leading, lagging, and coincident. Understanding these classifications helps analysts predict economic trends and make informed investment decisions.
1. Leading Indicators
-
Definition: Leading indicators are economic variables that change before the overall economy changes. They are used to forecast future economic activity.
-
Characteristics: These indicators provide an early signal of upcoming economic shifts, allowing investors and policymakers to anticipate changes in the business cycle.
-
Examples:
-
Stock Market Indices: A rising stock market often precedes economic expansion, while a falling market may signal a contraction.
- Explanation: Stock prices reflect investor expectations about future corporate earnings and economic growth.
- Example: A sustained increase in the NIFTY 50 or SENSEX could indicate an optimistic outlook for the Indian economy.
-
Building Permits: The number of new building permits issued indicates future construction activity.
- Explanation: Increased building permits suggest a growing demand for housing and commercial space, driving economic growth.
- Example: A surge in building permits in major cities could signal a boom in the real estate sector.
-
New Orders for Durable Goods: Orders for manufactured goods expected to last three years or more reflect business investment plans.
- Explanation: An increase in new orders suggests that businesses are confident about future demand and are investing in capital goods.
- Example: A rise in new orders for machinery and equipment could indicate an expansion in manufacturing activity.
-
Consumer Confidence Index: Measures how optimistic consumers are about the economy.
- Explanation: Higher consumer confidence leads to increased spending, which drives economic growth.
- Example: A survey showing a significant increase in consumer confidence could suggest a rise in retail sales.
-
Interest Rate Spread (Yield Curve): The difference between long-term and short-term interest rates.
- Explanation: A widening spread (especially a steepening yield curve) can indicate expectations of stronger economic growth. An inverted yield curve (short-term rates higher than long-term rates) is often seen as a recessionary signal.
- Example: If the 10-year government bond yield is significantly higher than the 3-month treasury bill yield, this could signal expectations of future economic growth.
-
Money Supply (M2): Measures the amount of money circulating in the economy.
- Explanation: A rapid increase in the money supply can lead to inflation and economic expansion.
- Example: A significant increase in M2 could indicate rising liquidity and potential inflationary pressures.
-
Stock Market Indices: A rising stock market often precedes economic expansion, while a falling market may signal a contraction.
-
Limitations: Leading indicators are not always accurate and can sometimes provide false signals.
2. Lagging Indicators
-
Definition: Lagging indicators are economic variables that change after the overall economy changes. They confirm trends that have already started.
-
Characteristics: These indicators are used to validate economic patterns and are helpful in understanding the magnitude and duration of economic cycles.
-
Examples:
-
Unemployment Rate: The percentage of the labor force that is unemployed.
- Explanation: Unemployment tends to rise after a recession begins and falls after a recovery has started.
- Example: A persistent decline in the unemployment rate confirms that the economy is recovering.
-
Inflation Rate (Consumer Price Index - CPI): Measures the rate at which prices are rising.
- Explanation: Inflation tends to rise after a period of economic expansion and may lag changes in monetary policy.
- Example: A sustained increase in the CPI confirms that inflationary pressures are building in the economy.
-
Prime Interest Rate: The interest rate that banks charge their most creditworthy customers.
- Explanation: The prime rate tends to lag changes in the federal funds rate and reflects overall credit conditions.
- Example: A decrease in the prime rate signals easing credit conditions after a period of economic tightening.
-
Corporate Profits: The earnings of companies after taxes.
- Explanation: Corporate profits tend to rise after an economic recovery is underway and decline after a recession has begun.
- Example: A significant increase in corporate profits confirms that businesses are benefiting from improved economic conditions.
-
Inventory-to-Sales Ratio: The ratio of inventory levels to sales.
- Explanation: This ratio can indicate whether businesses are holding too much or too little inventory relative to demand. It typically declines as a recovery takes hold.
- Example: A declining inventory-to-sales ratio could suggest that demand is outpacing supply, signaling stronger economic activity.
-
Unemployment Rate: The percentage of the labor force that is unemployed.
-
Usefulness: Lagging indicators provide confirmation of economic trends but are less useful for forecasting.
3. Coincident Indicators
-
Definition: Coincident indicators are economic variables that change at the same time as the overall economy. They provide information about the current state of the economy.
-
Characteristics: These indicators help analysts assess the current economic situation and identify turning points in the business cycle.
-
Examples:
-
Gross Domestic Product (GDP): Measures the total value of goods and services produced in a country.
- Explanation: GDP is the broadest measure of economic activity and is a key indicator of economic health.
- Example: A quarterly GDP report showing positive growth confirms that the economy is expanding.
-
Industrial Production Index: Measures the output of factories, mines, and utilities.
- Explanation: Industrial production is a key indicator of manufacturing activity and overall economic output.
- Example: An increase in the industrial production index signals stronger manufacturing activity.
-
Personal Income: Measures the income received by individuals from all sources.
- Explanation: Personal income is a key driver of consumer spending and economic growth.
- Example: A rise in personal income suggests that consumers have more money to spend, boosting economic activity.
-
Retail Sales: Measures the sales of goods and services by retailers.
- Explanation: Retail sales are a key indicator of consumer spending and overall economic health.
- Example: An increase in retail sales confirms that consumer demand is strong.
-
Employment Levels: The number of people currently employed.
- Explanation: Employment levels provide a direct measure of the strength of the labor market.
- Example: An increase in employment levels indicates a healthy labor market and economic expansion.
-
Gross Domestic Product (GDP): Measures the total value of goods and services produced in a country.
-
Usefulness: Coincident indicators provide a snapshot of the current economic situation and are used in conjunction with leading and lagging indicators to assess the overall health of the economy.
Conclusion:
Understanding the different types of macroeconomic indicators is crucial for economic analysis and investment decision-making. Leading indicators can help anticipate future economic trends, lagging indicators confirm past trends, and coincident indicators provide a current assessment of the economy. By analyzing these indicators together, investors can gain a more complete picture of the economic environment and make more informed choices.
No Comments