
Measuring Risk
Standard Deviation, Coefficient of Variation, Beta, and Alpha
Core Concept: Quantifying risk is essential for comparing investment opportunities and constructing well-balanced portfolios. Standard Deviation, Coefficient of Variation, Beta, and Alpha provide different perspectives on risk and return.
1. Standard Deviation (σ) - Measures Total Risk
-
Definition: Standard deviation measures the dispersion or variability of returns around the average return. A higher standard deviation indicates a wider range of potential outcomes, suggesting greater risk.
-
Formula:
σ = √[ Σ (Ri - R̄)² / (N - 1) ]- Where:
-
Ri= Each individual return observation -
R̄= Average return -
N= Number of observations -
Σ= Summation
-
- Where:
-
Example:
Year Stock A Return Stock B Return 1 10% 5% 2 12% 6% 3 8% 20% 4 9% -5% -
Stock A has more stable returns, while Stock B exhibits greater fluctuation.
-
After calculation:
- Stock A's standard deviation ≈ 1.71%
- Stock B's standard deviation ≈ 10.84%
-
-
Interpretation:
- Low Standard Deviation: Suggests that the investment's returns are clustered closely around the average, indicating lower risk.
- High Standard Deviation: Suggests that the investment's returns are more dispersed, indicating higher risk and greater potential for both gains and losses.
-
Use Case: Useful for comparing the risk of two investments with similar average returns. If returns are dissimilar, see Coefficient of Variation.
2. Coefficient of Variation (CV) - Measures Risk per Unit of Return
-
Definition: The coefficient of variation (CV) measures the amount of risk (standard deviation) relative to the expected return. It's particularly useful for comparing investments with different average returns.
-
Formula:
CV = σ / R̄- Where:
-
σ= Standard Deviation -
R̄= Average Return
-
- Where:
-
Example:
Investment Average Return Standard Deviation Stock X 10% 5% Stock Y 12% 8% - Stock X: CV = 5% / 10% = 0.5
- Stock Y: CV = 8% / 12% = 0.67
-
Interpretation:
- Lower CV: Indicates that the investment offers a better risk-adjusted return. You're getting more return for the amount of risk you're taking.
- Higher CV: Indicates that the investment has more risk per unit of return.
-
Use Case: When comparing investments with different average returns, the CV allows you to determine which investment provides the best return for the level of risk involved.
3. Beta (β) - Measures Market Risk
-
Definition: Beta measures a stock's volatility relative to the overall market (e.g., NIFTY 50, SENSEX). It quantifies how much a stock's price tends to move in response to market fluctuations.
-
Interpretation:
-
β = 1: The stock's price tends to move in the same direction and magnitude as the market. -
β > 1: The stock is more volatile than the market. It's expected to amplify market movements (higher risk, potentially higher return). -
β < 1: The stock is less volatile than the market. It's expected to dampen market movements (lower risk, potentially more stable). -
β = 0: The stock's price is uncorrelated with the market. -
β < 0: The stock's price tends to move in the opposite direction of the market (rare).
-
-
Formula:
β = Cov(Rs, Rm) / Var(Rm)- Where:
-
Cov(Rs, Rm)= Covariance between the stock's return and the market's return -
Var(Rm)= Variance of the market's return
-
- Where:
-
Example:
- Stock A has β = 1.5: If the market increases by 10%, Stock A is expected to increase by 15%.
- Stock B has β = 0.7: If the market increases by 10%, Stock B is expected to increase by only 7%.
-
Application:
- Bull Market: Investors may prefer high-beta stocks to capitalize on market gains.
- Recession: Investors may prefer low-beta stocks to reduce risk and preserve capital.
4. Alpha (α) - Measures Excess Return Over Market
-
Definition: Alpha represents the excess return generated by an investment or portfolio above and beyond what would be expected based on its beta and the market return. It indicates how much value a portfolio manager has added (or subtracted) through their investment decisions.
-
Formula:
α = Rp - [Rf + β(Rm - Rf)]- Where:
-
Rp= Portfolio Return -
Rf= Risk-free rate (e.g., return on a government bond) -
Rm= Market Return -
β= Portfolio's beta
-
- Where:
-
Example:
- Market return (Rm) = 12%
- Risk-free rate (Rf) = 5%
- Portfolio beta (β) = 1.2
- Expected return = 5 + 1.2 * (12 - 5) = 13.4%
- If the portfolio's actual return (Rp) = 15%:
- α = 15 - 13.4 = 1.6%
-
Interpretation:
- Positive Alpha: Indicates that the investment outperformed its expected return, suggesting good investment decisions.
- Negative Alpha: Indicates that the investment underperformed its expected return.
- Zero Alpha: Indicates that the investment performed as expected based on its beta and the market return.
-
Application:
- Fund managers strive for positive alpha by selecting superior stocks or employing effective investment strategies.
- Passive investors (e.g., those investing in index funds) typically aim for zero alpha, as they seek to match market returns.

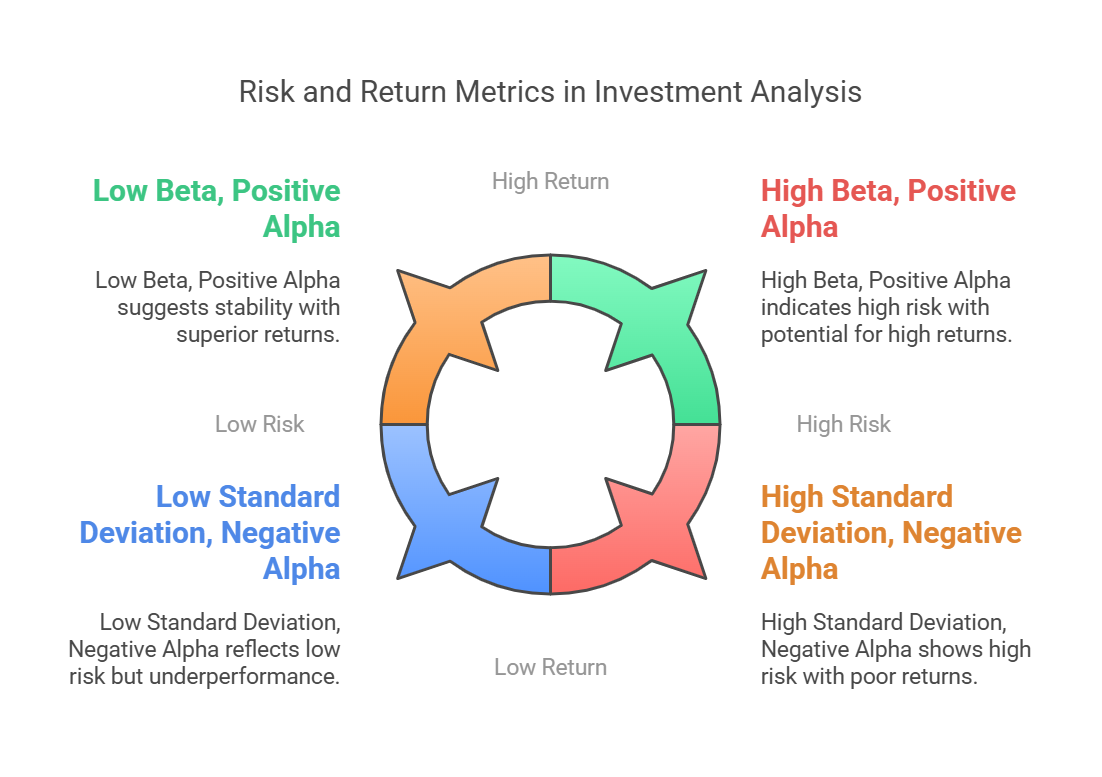
Key Takeaways
- Standard Deviation: Measures the total risk or volatility of an investment's returns.
- Coefficient of Variation: Measures risk per unit of return, enabling comparison of investments with different average returns.
- Beta: Measures systematic risk, indicating how sensitive a stock's price is to market movements.
- Alpha: Measures excess return, revealing whether an investment has outperformed or underperformed its expected return.
No Comments