
Technical Charts & Patterns and Indicators
Moving Averages
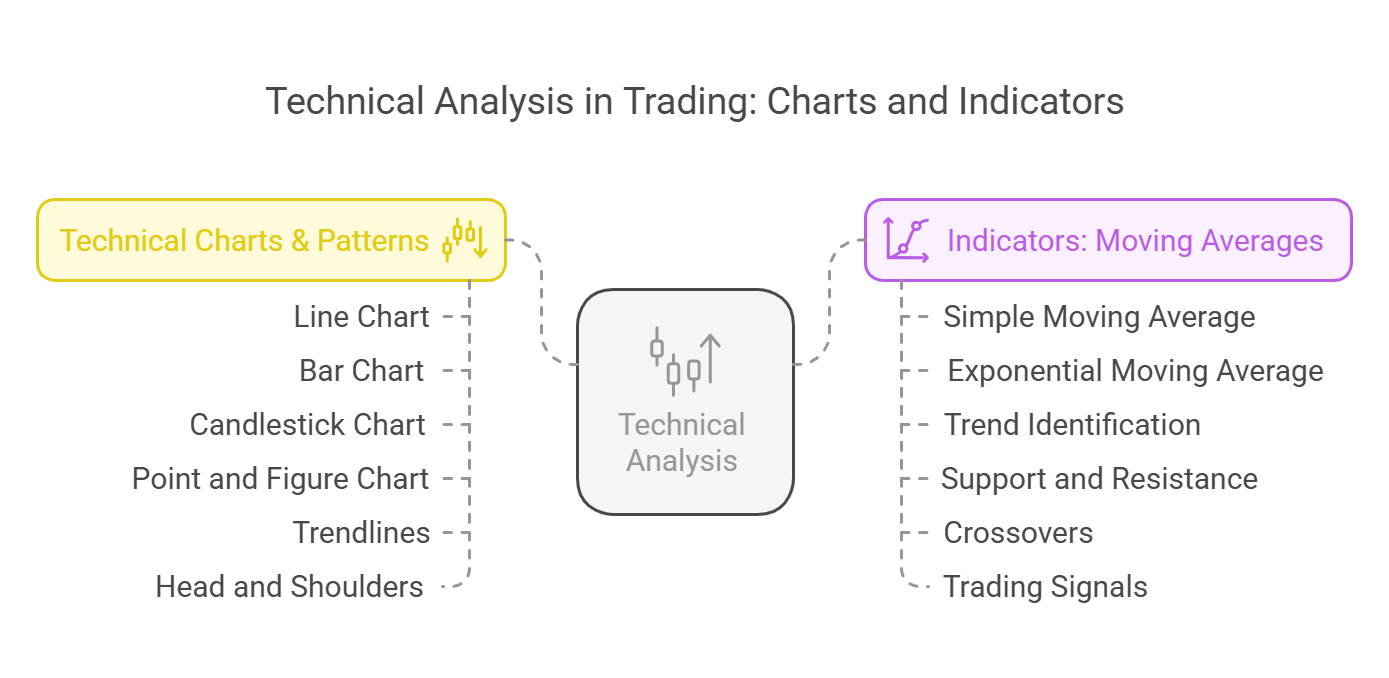
Core Concept: Technical charts and patterns are visual representations of price movements that help traders and analysts identify trends, potential reversals, and trading opportunities. Indicators, like Moving Averages, are mathematical calculations based on price and volume data that provide further insights into market conditions and potential future price direction.
1. Technical Charts & Patterns
-
Definition: Technical charts are visual representations of a security's price movements over a specific period. They provide a historical record of price action and allow analysts to identify patterns and trends.
-
Types of Charts:
-
a) Line Chart:
- Description: The simplest type of chart, connecting closing prices over a period.
- Use: Provides a clear view of the overall trend.
- Limitations: Does not show the high, low, or open prices.
-
b) Bar Chart:
- Description: Displays the open, high, low, and close prices for each period. A vertical bar represents the high and low prices, with a small line on the left indicating the open price and a small line on the right indicating the close price.
- Use: Provides more detailed information than a line chart.
- Commonly used to identify candlestick patterns
-
c) Candlestick Chart:
- Description: Similar to a bar chart but uses "candles" to represent price movements. The body of the candle represents the range between the open and close prices. If the close is higher than the open, the body is typically filled in white or green (bullish candle). If the close is lower than the open, the body is filled in black or red (bearish candle).
- Use: Provides a visual representation of the price action and is useful for identifying candlestick patterns.
- Example: A long green candle indicates strong buying pressure, while a long red candle indicates strong selling pressure.
-
d) Point and Figure Chart:
- Description: A chart that filters out minor price movements and focuses on significant price changes. It uses "X"s to represent rising prices and "O"s to represent falling prices.
- Use: Helps to identify support and resistance levels and potential breakouts.
- Does not account for time, only price movement
-
-
Chart Patterns:
-
a) Trendlines:
- Description: Lines drawn on a chart to connect a series of high or low prices, indicating the direction of the trend.
- Uptrend Line: Drawn along a series of higher lows.
- Downtrend Line: Drawn along a series of lower highs.
- Use: Identify the direction of the trend and potential support and resistance levels.
-
b) Head and Shoulders:
- Description: A reversal pattern that consists of three peaks, with the middle peak (the "head") being the highest and the two outer peaks (the "shoulders") being lower. A "neckline" connects the lows between the peaks.
- Interpretation: Indicates a potential reversal from an uptrend to a downtrend.
- Trading Signal: Sell when the price breaks below the neckline.
-
c) Inverse Head and Shoulders:
- Description: The opposite of the head and shoulders pattern, consisting of three troughs, with the middle trough being the lowest and the two outer troughs being higher.
- Interpretation: Indicates a potential reversal from a downtrend to an uptrend.
- Trading Signal: Buy when the price breaks above the neckline.
-
d) Double Top:
- Description: A reversal pattern that consists of two peaks at approximately the same price level.
- Interpretation: Indicates a potential reversal from an uptrend to a downtrend.
- Trading Signal: Sell when the price breaks below the support level between the peaks.
-
e) Double Bottom:
- Description: A reversal pattern that consists of two troughs at approximately the same price level.
- Interpretation: Indicates a potential reversal from a downtrend to an uptrend.
- Trading Signal: Buy when the price breaks above the resistance level between the troughs.
-
f) Triangles:
- Description: Patterns formed by converging trendlines.
- Ascending Triangle: Upper trendline is horizontal (resistance), lower trendline is rising (support). Bullish pattern.
- Descending Triangle: Lower trendline is horizontal (support), upper trendline is falling (resistance). Bearish pattern.
- Symmetrical Triangle: Both trendlines are converging. Can be either bullish or bearish.
-
2. Indicators: Moving Averages
-
Definition: A moving average (MA) is a technical indicator that smooths out price data by calculating the average price over a specified period. It helps to identify trends and potential support and resistance levels.
-
Types of Moving Averages:
-
a) Simple Moving Average (SMA):
- Calculation: The SMA is calculated by adding up the closing prices for a specified period and dividing by the number of periods.
- Formula: SMA = (Sum of Closing Prices over N Periods) / N
- Example: A 50-day SMA is calculated by adding up the closing prices for the last 50 days and dividing by 50.
- Use: Provides a simple and straightforward way to smooth out price data.
-
b) Exponential Moving Average (EMA):
- Calculation: The EMA gives more weight to recent prices, making it more responsive to changes in the price trend.
-
Formula: EMA = (Closing Price * Multiplier) + (Previous EMA * (1 - Multiplier))
- Multiplier = 2 / (Number of Periods + 1)
- Example: A 12-day EMA gives more weight to the most recent 12 days of price data.
- Use: More sensitive to recent price changes than the SMA.
-
-
Interpretation and Uses of Moving Averages:
-
a) Trend Identification:
- Price Above Moving Average: Suggests that the price is in an uptrend.
- Price Below Moving Average: Suggests that the price is in a downtrend.
-
b) Support and Resistance:
- Moving averages can act as dynamic support or resistance levels. The price may bounce off a moving average during an uptrend or be rejected by a moving average during a downtrend.
-
c) Crossovers:
- Golden Cross: Occurs when a shorter-term moving average (e.g., 50-day) crosses above a longer-term moving average (e.g., 200-day). This is generally considered a bullish signal.
- Death Cross: Occurs when a shorter-term moving average crosses below a longer-term moving average. This is generally considered a bearish signal.
-
d) Trading Signals:
- Buy when the price crosses above a moving average.
- Sell when the price crosses below a moving average.
- But be careful of whipsaws, where the price quickly crosses back and forth over the MA
-
-
Choosing the Period:
- The choice of the period for a moving average depends on the trading style and time horizon.
- Short-Term Traders: May use shorter-term moving averages (e.g., 10-day, 20-day) to identify short-term trends.
- Long-Term Investors: May use longer-term moving averages (e.g., 50-day, 200-day) to identify long-term trends.
Conclusion:
Technical charts and patterns, along with indicators like moving averages, are valuable tools for technical analysts to identify trends, potential reversals, and trading opportunities. By combining chart analysis with the insights provided by moving averages, traders and investors can make more informed decisions about when to enter and exit positions.
No Comments