
Trends
Resistance and Support
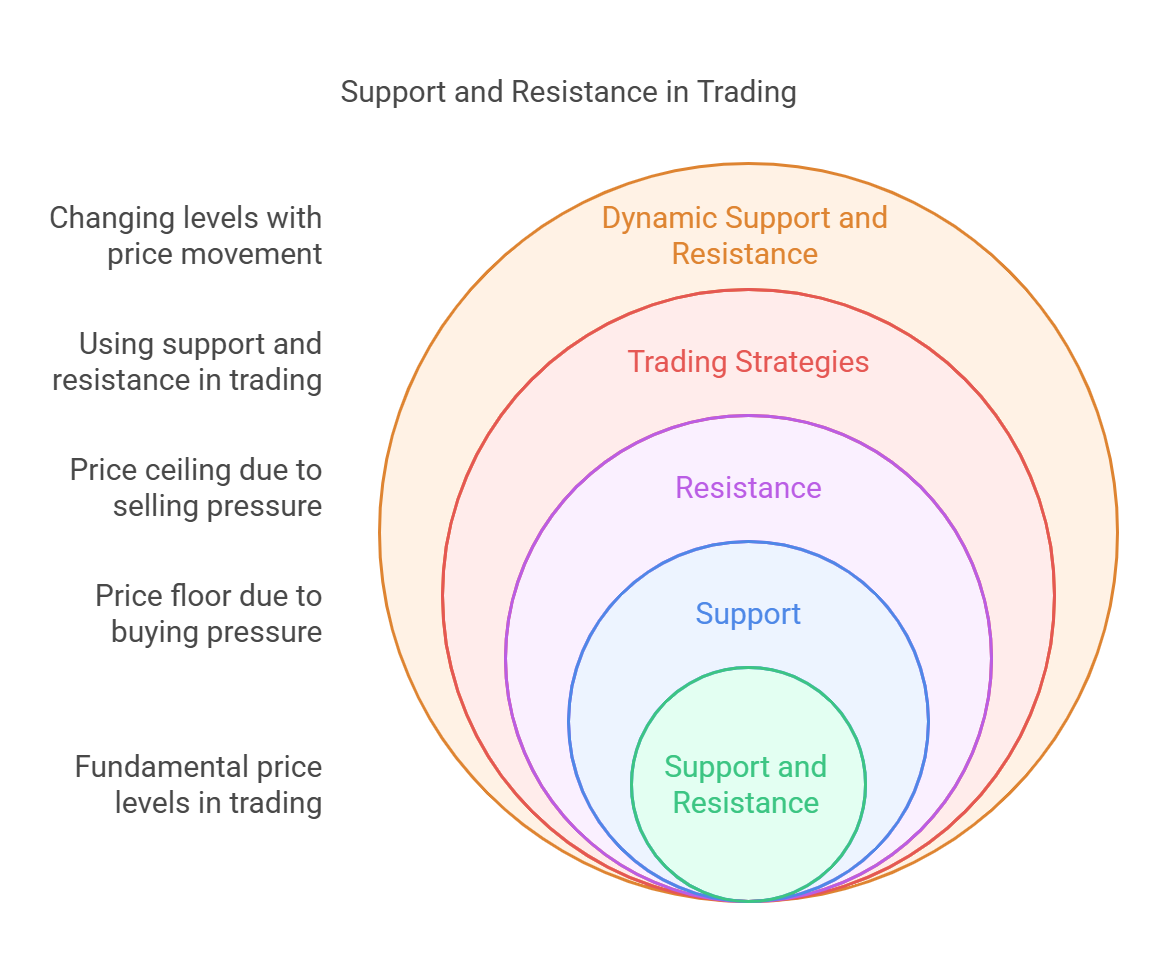
Core Concept: Support and resistance levels are fundamental concepts in technical analysis that identify key price levels where buying or selling pressure is expected to be strong enough to pause or reverse a prevailing trend. They represent areas on a price chart where the forces of supply and demand are concentrated.
1. Support
- Definition: Support is a price level where a stock or asset's price tends to stop falling because there is a concentration of buyers who are willing to purchase the asset at that price. It acts as a "floor" for the price.
- Rationale: As the price approaches a support level, buyers are more likely to enter the market, anticipating that the price will not fall below that level. This increased buying pressure can halt the decline and potentially reverse the trend.
-
Identification: Support levels can be identified by:
- Previous Lows: A prior low price point often acts as future support.
- Trendlines: Upward-sloping trendlines can act as dynamic support levels.
- Moving Averages: Certain moving averages (e.g., 50-day, 200-day) can act as support levels.
- Fibonacci Retracement Levels: Specific Fibonacci retracement levels can act as support.
-
Example:
- A stock price has repeatedly bounced off the ₹100 level in the past. This suggests that ₹100 is a support level. If the price declines towards ₹100 again, buyers are likely to step in and prevent the price from falling further.
-
Broken Support Becomes Resistance:
- If the price breaks below a support level, that level can then become resistance in the future. This is because traders who previously bought at the support level may now be looking to sell to break even if the price returns to that level.
-
Strength of Support:
- The strength of a support level depends on several factors:
- Number of Times Tested: The more times a support level has been tested (i.e., the price has bounced off it), the stronger it is considered to be.
- Volume: High volume on the bounce from a support level suggests strong buying pressure.
- Timeframe: Support levels on longer-term charts (e.g., weekly, monthly) are generally considered to be more significant than those on shorter-term charts (e.g., daily, hourly).
- The strength of a support level depends on several factors:
2. Resistance
- Definition: Resistance is a price level where a stock or asset's price tends to stop rising because there is a concentration of sellers who are willing to sell the asset at that price. It acts as a "ceiling" for the price.
- Rationale: As the price approaches a resistance level, sellers are more likely to enter the market, anticipating that the price will not rise above that level. This increased selling pressure can halt the advance and potentially reverse the trend.
-
Identification: Resistance levels can be identified by:
- Previous Highs: A prior high price point often acts as future resistance.
- Trendlines: Downward-sloping trendlines can act as dynamic resistance levels.
- Moving Averages: Certain moving averages (e.g., 50-day, 200-day) can act as resistance levels.
- Fibonacci Retracement Levels: Specific Fibonacci retracement levels can act as resistance.
-
Example:
- A stock price has repeatedly failed to break above the ₹150 level in the past. This suggests that ₹150 is a resistance level. If the price rises towards ₹150 again, sellers are likely to step in and prevent the price from rising further.
-
Broken Resistance Becomes Support:
- If the price breaks above a resistance level, that level can then become support in the future. This is because traders who previously sold at the resistance level may now be looking to buy to avoid missing out on further gains if the price returns to that level.
-
Strength of Resistance:
- The strength of a resistance level depends on several factors:
- Number of Times Tested: The more times a resistance level has been tested (i.e., the price has failed to break above it), the stronger it is considered to be.
- Volume: High volume on the rejection from a resistance level suggests strong selling pressure.
- Timeframe: Resistance levels on longer-term charts are generally considered to be more significant.
- The strength of a resistance level depends on several factors:
3. Using Support and Resistance in Trading
-
Entry Points:
- Long Positions (Buying): Traders may look to enter long positions near support levels, anticipating a bounce.
- Short Positions (Selling): Traders may look to enter short positions near resistance levels, anticipating a reversal.
-
Exit Points:
- Long Positions: Traders may set profit targets near resistance levels.
- Short Positions: Traders may set profit targets near support levels.
-
Stop-Loss Orders:
- Traders often place stop-loss orders just below support levels when holding long positions to limit potential losses if the price breaks below support.
- Traders often place stop-loss orders just above resistance levels when holding short positions to limit potential losses if the price breaks above resistance.
-
Breakouts:
- When the price breaks above a resistance level or below a support level, it is known as a breakout. Breakouts can signal the start of a new trend.
- Traders may look to enter positions in the direction of the breakout, anticipating further price movement in that direction.
4. Dynamic Support and Resistance
- Definition: Dynamic support and resistance levels are levels that change over time as the price moves.
-
Examples:
- Trendlines: Upward-sloping trendlines act as dynamic support, while downward-sloping trendlines act as dynamic resistance.
- Moving Averages: Moving averages can act as dynamic support or resistance, depending on the direction of the price.
Conclusion:
Support and resistance levels are valuable tools for technical analysts to identify potential buying and selling opportunities, set profit targets, and manage risk. By understanding the principles of support and resistance, traders and investors can make more informed decisions about when to enter and exit positions.
No Comments