
Relative Valuation Models Using Ratios
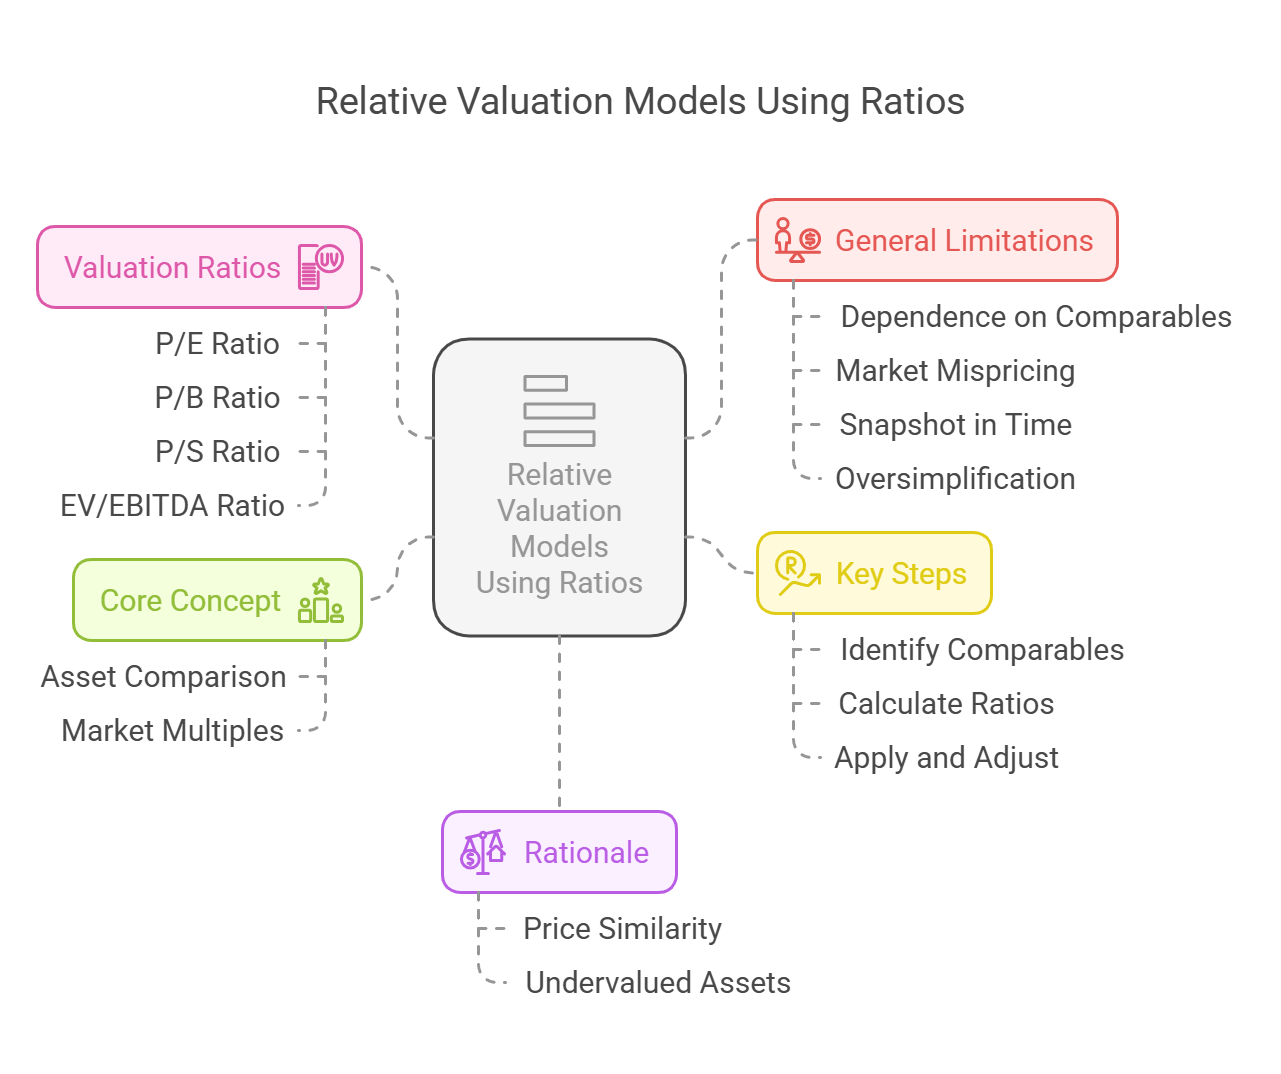
Core Concept: Relative valuation involves determining the value of an asset by comparing it to the values of similar assets. Instead of focusing on a company's intrinsic value derived from its cash flows, relative valuation uses market multiples, such as the P/E ratio, to assess whether an asset is fairly valued relative to its peers.
Rationale: Relative valuation is based on the idea that similar assets should trade at similar prices or multiples. If a company is trading at a lower multiple than its peers, it may be undervalued, and vice versa.
 Key Steps in Relative Valuation:
- Identify Comparable Companies: Find companies that are similar to the target company in terms of industry, size, growth rate, risk, and other relevant characteristics.
- Calculate Valuation Ratios: Calculate the relevant valuation ratios for the comparable companies.
- Determine the Average or Median Ratio: Calculate the average or median valuation ratio for the comparable companies.
- Apply the Ratio to the Target Company: Apply the average or median ratio to the target company's corresponding financial metric to estimate its value.
- Adjust for Differences: Make adjustments to the valuation to account for any significant differences between the target company and the comparable companies.
Commonly Used Valuation Ratios:
1. Price-to-Earnings (P/E) Ratio
-
Definition: The P/E ratio measures the relationship between a company's stock price and its earnings per share (EPS). It indicates how much investors are willing to pay for each rupee of earnings.
-
Formula:
P/E Ratio = Market Price per Share / Earnings per Share (EPS) -
Interpretation:
- High P/E Ratio: Suggests that investors expect high future growth from the company. It could also indicate that the stock is overvalued.
- Low P/E Ratio: Suggests that investors have lower expectations for future growth or that the stock is undervalued.
-
Types of P/E Ratios:
- Trailing P/E: Uses the company's past earnings (typically the last 12 months).
- Forward P/E: Uses the company's expected future earnings (typically the next 12 months).
-
Example:
- Company A's stock price is ₹50, and its EPS is ₹5.
- P/E Ratio = ₹50 / ₹5 = 10
- If the average P/E ratio for comparable companies is 15, Company A may be undervalued.
- Estimated Value = EPS * Average P/E = ₹5 * 15 = ₹75
-
Limitations:
- Earnings can be volatile and subject to accounting manipulation.
- The P/E ratio does not consider a company's debt levels or cash flow.
- It is less useful for companies with negative earnings.
2. Price-to-Book (P/B) Ratio
-
Definition: The P/B ratio measures the relationship between a company's stock price and its book value per share. It indicates how much investors are willing to pay for each rupee of net assets.
-
Formula:
P/B Ratio = Market Price per Share / Book Value per Share -
Interpretation:
- High P/B Ratio: Suggests that investors believe the company's assets are undervalued on the balance sheet or that the company has strong intangible assets (e.g., brand reputation).
- Low P/B Ratio: Suggests that the company's assets are overvalued or that the company is facing financial difficulties.
-
Example:
- Company B's stock price is ₹40, and its book value per share is ₹8.
- P/B Ratio = ₹40 / ₹8 = 5
- If the average P/B ratio for comparable companies is 3, Company B may be overvalued.
- Estimated Value = Book Value * Average P/B = ₹8 * 3 = ₹24
-
Limitations:
- Book value is based on historical costs and may not reflect the current market value of assets.
- The P/B ratio is less useful for service companies with few tangible assets.
3. Price-to-Sales (P/S) Ratio
-
Definition: The P/S ratio measures the relationship between a company's stock price and its revenue per share. It indicates how much investors are willing to pay for each rupee of sales.
-
Formula:
P/S Ratio = Market Price per Share / Revenue per Share -
Interpretation:
- High P/S Ratio: Suggests that investors expect high revenue growth from the company.
- Low P/S Ratio: Suggests that the company is undervalued relative to its sales.
-
Example:
- Company C's stock price is ₹60, and its revenue per share is ₹15.
- P/S Ratio = ₹60 / ₹15 = 4
- If the average P/S ratio for comparable companies is 2, Company C may be overvalued.
- Estimated Value = Revenue per Share * Average P/S = ₹15 * 2 = ₹30
-
Limitations:
- The P/S ratio does not consider a company's profitability or cost structure.
- Revenue can be subject to accounting manipulation.
4. Enterprise Value-to-EBITDA (EV/EBITDA)
-
Definition: The EV/EBITDA ratio measures the relationship between a company's enterprise value (market capitalization plus debt minus cash) and its earnings before interest, taxes, depreciation, and amortization (EBITDA). It provides a more comprehensive valuation measure than the P/E ratio, as it considers a company's debt and cash.
-
Formula:
EV/EBITDA = Enterprise Value / EBITDA -
Interpretation:
- High EV/EBITDA: Suggests that the company is overvalued relative to its operating performance.
- Low EV/EBITDA: Suggests that the company is undervalued.
-
Example:
- Company D's enterprise value is ₹500 crore, and its EBITDA is ₹50 crore.
- EV/EBITDA = ₹500 crore / ₹50 crore = 10
- If the average EV/EBITDA for comparable companies is 8, Company D may be overvalued.
- Estimated Value = EBITDA * Average EV/EBITDA = ₹50 crore * 8 = ₹400 crore (for the Enterprise Value)
-
Limitations:
- EBITDA is not a true measure of cash flow, as it does not consider changes in working capital or capital expenditures.
- The EV/EBITDA ratio is less useful for companies with negative EBITDA.
General Limitations of Relative Valuation
- Dependence on Comparables: The accuracy of relative valuation depends on the quality and comparability of the companies used.
- Market Mispricing: Relative valuation assumes that the market is correctly valuing comparable companies, which may not always be the case.
- Snapshot in Time: Relative valuation provides a snapshot of value at a specific point in time and does not consider future growth prospects or changes in market conditions.
- Oversimplification: Ratios are a simplification of complex business realities and may not capture all the relevant factors that influence a company's value.
Conclusion:
Relative valuation models using ratios can be valuable tools for assessing whether a stock is fairly valued relative to its peers. However, it's essential to use these models in conjunction with other valuation techniques and to consider the limitations of each ratio. A comprehensive approach to valuation involves analyzing both relative and intrinsic value to make well-informed investment decisions.
No Comments