
Portfolio Analysis
Portfolio Risk and Return
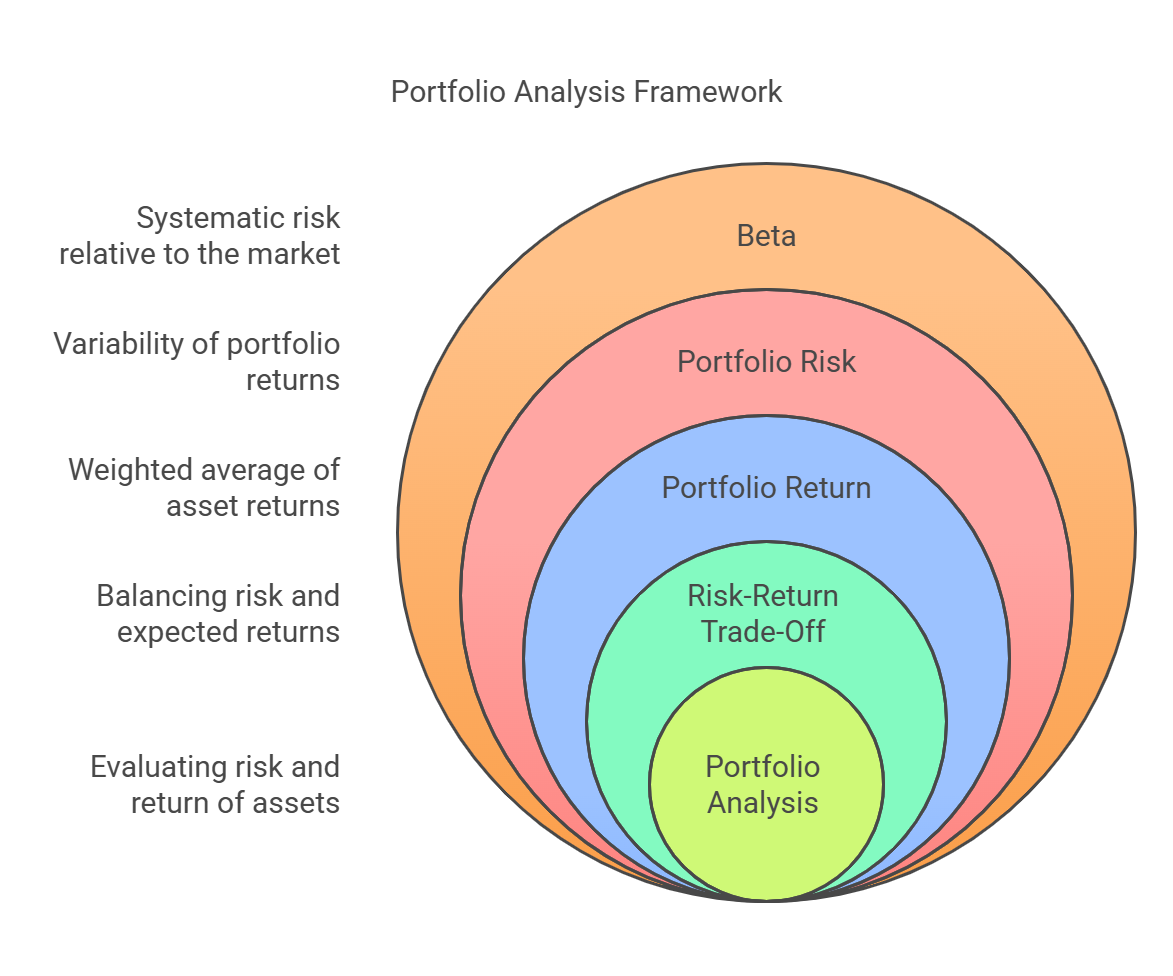
Core Concept: Portfolio analysis involves evaluating the risk and return characteristics of a collection of assets (a portfolio) rather than individual assets in isolation. The goal is to construct a portfolio that maximizes return for a given level of risk or minimizes risk for a desired level of return.
 Key Principles:
- Diversification: Combining different assets in a portfolio can reduce overall risk because the assets' returns may not be perfectly correlated.
- Modern Portfolio Theory (MPT): A framework developed by Harry Markowitz that emphasizes the importance of diversification and the relationship between risk and return in portfolio construction.
- Efficient Frontier: The set of portfolios that offer the highest expected return for a given level of risk or the lowest risk for a given level of expected return.
1. Portfolio Return
-
Definition: Portfolio return is the weighted average of the returns of the individual assets in the portfolio.
-
Formula:
Rp = Σ (wi * Ri)- Where:
-
Rp= Portfolio return -
wi= Weight of asset i in the portfolio (the proportion of the portfolio's total value invested in asset i) -
Ri= Return of asset i -
Σ= Summation across all assets in the portfolio
-
- Where:
-
Example:
- A portfolio consists of two assets:
- Asset A: Weight = 60%, Return = 10%
- Asset B: Weight = 40%, Return = 15%
- Portfolio Return = (0.60 * 0.10) + (0.40 * 0.15) = 0.06 + 0.06 = 0.12 or 12%
- A portfolio consists of two assets:
-
Explanation: The portfolio return is simply the sum of the returns of each asset, weighted by its proportion in the portfolio.
2. Portfolio Risk
-
Definition: Portfolio risk is the variability or uncertainty of the portfolio's returns. It is measured by the portfolio's standard deviation.
-
Calculation: The calculation of portfolio risk is more complex than portfolio return because it takes into account the correlation between the assets in the portfolio.
-
Formula (Two-Asset Portfolio):
σp = √[(w1^2 * σ1^2) + (w2^2 * σ2^2) + (2 * w1 * w2 * ρ1,2 * σ1 * σ2)]- Where:
-
σp= Portfolio standard deviation (risk) -
w1= Weight of asset 1 in the portfolio -
w2= Weight of asset 2 in the portfolio -
σ1= Standard deviation of asset 1 -
σ2= Standard deviation of asset 2 -
ρ1,2= Correlation coefficient between asset 1 and asset 2
-
- Where:
-
Correlation Coefficient (ρ):
- Measures the degree to which two assets' returns move together.
- Ranges from -1 to +1:
-
ρ = +1: Perfect positive correlation (assets move in the same direction). -
ρ = -1: Perfect negative correlation (assets move in opposite directions). -
ρ = 0: No correlation (assets' movements are unrelated).
-
- Diversification Benefit: The lower the correlation between assets in a portfolio, the greater the diversification benefit and the lower the portfolio risk.
-
Example (Two-Asset Portfolio):
- A portfolio consists of two assets:
- Asset A: Weight = 60%, Standard Deviation = 15%
- Asset B: Weight = 40%, Standard Deviation = 20%
- Correlation Coefficient between A and B = 0.5
- σp = √[(0.60^2 * 0.15^2) + (0.40^2 * 0.20^2) + (2 * 0.60 * 0.40 * 0.5 * 0.15 * 0.20)]
- σp = √[(0.36 * 0.0225) + (0.16 * 0.04) + (0.72 * 0.5 * 0.03)]
- σp = √[0.0081 + 0.0064 + 0.0108] = √0.0253 ≈ 0.1591 or 15.91%
- Interpretation: The portfolio's standard deviation is 15.91%. Note that this is less than a simple weighted average of the individual asset's standard deviations because of diversification (ρ is less than 1).
- A portfolio consists of two assets:
-
General Formula (N-Asset Portfolio): For a portfolio with N assets, the formula becomes more complex and involves calculating the covariance between all pairs of assets. However, the principle remains the same: diversification reduces portfolio risk.
3. Risk-Return Trade-Off
- Efficient Frontier: The efficient frontier represents the set of portfolios that offer the highest expected return for a given level of risk or the lowest risk for a given level of expected return.
- Investor Preferences: Investors have different risk preferences. Some are risk-averse (prefer lower risk), while others are risk-tolerant (willing to take on more risk for higher potential returns).
- Optimal Portfolio: The optimal portfolio for an investor is the one that lies on the efficient frontier and matches their risk preferences.
- Capital Allocation Line (CAL): Represents the possible combinations of risk-free assets and risky portfolios. The optimal portfolio lies at the tangency point between the CAL and the efficient frontier.
4. Beta of a Portfolio
-
Definition: Beta measures the systematic risk of a portfolio relative to the market. It indicates how much the portfolio's returns are expected to move in response to market fluctuations.
-
Formula:
βp = Σ (wi * βi)- Where:
-
βp= Portfolio beta -
wi= Weight of asset i in the portfolio -
βi= Beta of asset i -
Σ= Summation across all assets in the portfolio
-
- Where:
-
Interpretation:
-
βp = 1: The portfolio's returns are expected to move in the same direction and magnitude as the market. -
βp > 1: The portfolio is more volatile than the market. -
βp < 1: The portfolio is less volatile than the market.
-
Conclusion:
Portfolio analysis is essential for constructing well-diversified portfolios that align with an investor's risk preferences and investment goals. By understanding the concepts of portfolio return, portfolio risk, correlation, and the risk-return trade-off, investors can make more informed decisions about asset allocation and portfolio construction.
No Comments