
Volume Indicators
Dow Theory, Small Investor Volumes & Other Indicators - Institutional Activity
Core Concept: Volume indicators are technical analysis tools that use trading volume data to confirm price trends, identify potential reversals, and gauge the level of participation in the market. Volume represents the number of shares or contracts traded during a specific period. Analyzing volume alongside price movements can provide valuable insights into market sentiment and the strength of a trend.
1. Volume in Dow Theory
- Dow Theory Principle: As discussed previously, Dow Theory states that volume should confirm the trend. In other words, volume should increase in the direction of the primary trend.
-
Interpretation:
-
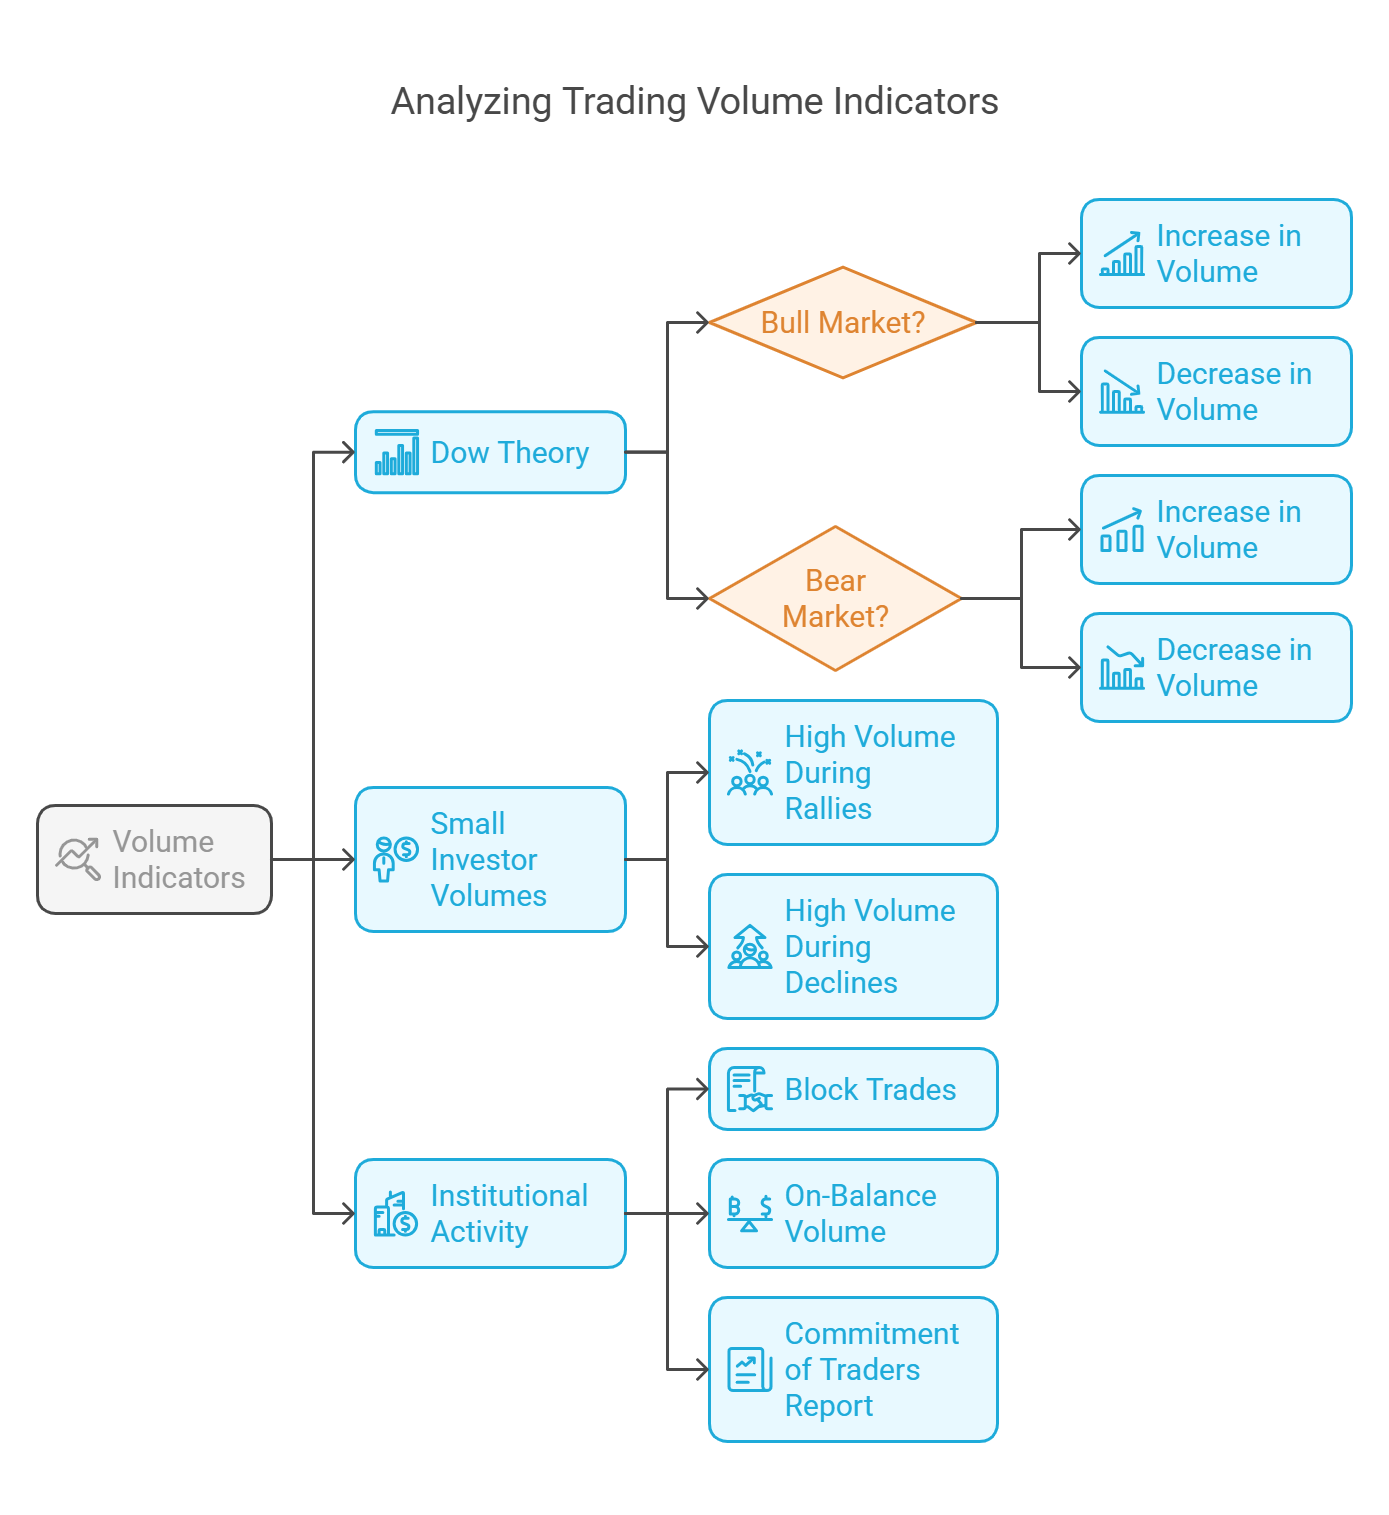
Bull Market:
- Volume should increase on rallies (upward price movements). This indicates strong buying pressure and confirms the strength of the uptrend.
- Volume should decrease on corrections (downward price movements). This indicates that selling pressure is weak and that the correction is likely temporary.
-
Bear Market:
- Volume should increase on declines (downward price movements). This indicates strong selling pressure and confirms the strength of the downtrend.
- Volume should decrease on rallies (upward price movements). This indicates that buying pressure is weak and that the rally is likely temporary.
-
Bull Market:
-
Example:
- If a stock price is rising and volume is also increasing, this is a bullish signal.
- If a stock price is falling and volume is also increasing, this is a bearish signal.
-
Divergence:
- When volume does not confirm the price trend, it can signal a potential trend reversal. For example, if a stock price is making new highs, but volume is declining, it may indicate that the uptrend is losing momentum. This is known as a non-confirmation.
2. Small Investor Volumes
- Concept: Analyzing the volume of trading activity attributed to small investors (retail investors) can provide insights into market sentiment and potential contrarian trading opportunities.
-
Interpretation:
- High Small Investor Volume During Rallies: May suggest that the rally is driven by inexperienced investors who are prone to emotional decision-making. This can be a sign of an overbought market and a potential correction.
- High Small Investor Volume During Declines: May suggest that small investors are panicking and selling their holdings. This can be a sign of an oversold market and a potential bounce.
- Low Small Investor Volume: Can indicate a lack of conviction among retail investors, potentially signaling a period of consolidation or a continuation of the existing trend.
-
Contrarian Investing:
- Some technical analysts use small investor volume as a contrarian indicator. They may take a position opposite to the prevailing sentiment of small investors. For example, if small investors are heavily buying a stock, a contrarian investor may sell the stock, anticipating a decline.
-
Data Sources:
- Information on small investor trading volume is generally difficult to obtain directly. However, some brokerage firms or financial data providers may offer insights into retail trading activity.
-
Caution:
- Relying solely on small investor volume as a trading signal can be risky. It's important to consider other technical and fundamental factors as well.
3. Other Indicators: Institutional Activity
- Concept: Monitoring the trading activity of institutional investors (e.g., mutual funds, hedge funds, pension funds) can provide valuable insights into market trends and potential future price movements.
- Rationale: Institutional investors typically have access to more resources, expertise, and information than individual investors. Their trading decisions can have a significant impact on market prices.
-
Indicators of Institutional Activity:
- Block Trades: Large-volume trades executed off the exchange. An increase in block trades can indicate institutional buying or selling.
-
On-Balance Volume (OBV): A momentum indicator that relates price and volume. It is based on the idea that volume precedes price.
-
Calculation:
- If today's closing price is higher than yesterday's, then: OBV = Previous OBV + Today's Volume
- If today's closing price is lower than yesterday's, then: OBV = Previous OBV - Today's Volume
- If today's closing price is the same as yesterday's, then: OBV = Previous OBV
-
Interpretation:
- OBV Rising: Suggests that buying pressure is increasing and that institutional investors are accumulating shares.
- OBV Falling: Suggests that selling pressure is increasing and that institutional investors are distributing shares.
- Divergence: When OBV diverges from the price, it can signal a potential trend reversal.
-
Calculation:
-
Accumulation/Distribution Line (A/D Line): A volume-based indicator that measures the flow of money into and out of a security.
-
Calculation: A/D = ((Close - Low) - (High - Close)) / (High - Low) * Volume
- If the close is near the high of the period, the A/D Line will rise, indicating accumulation.
- If the close is near the low of the period, the A/D Line will fall, indicating distribution.
-
Interpretation:
- A/D Line Rising: Suggests that buying pressure is increasing and that the security is being accumulated.
- A/D Line Falling: Suggests that selling pressure is increasing and that the security is being distributed.
- Divergence: When the A/D Line diverges from the price, it can signal a potential trend reversal.
-
Calculation: A/D = ((Close - Low) - (High - Close)) / (High - Low) * Volume
- Commitment of Traders (COT) Report: Provides data on the positions held by different types of traders in the futures market, including commercial traders (hedgers) and non-commercial traders (speculators). This can provide insights into institutional sentiment.
-
Data Sources:
- Information on institutional trading activity is often available from financial data providers, brokerage firms, and regulatory filings.
-
Caveats:
- Interpreting institutional activity can be challenging, as institutional investors may have different investment objectives and time horizons.
- It's important to consider other technical and fundamental factors as well.
Conclusion:
Volume indicators play a crucial role in technical analysis by confirming price trends, identifying potential reversals, and gauging the level of participation in the market. Analyzing volume in conjunction with price movements, small investor activity, and institutional activity can provide valuable insights into market sentiment and potential future price movements.
No Comments